Full Report
What the industry sells
A US cable broadband operator sells a monthly subscription to a physical connection. The product is capacity delivered to a fixed address over a wire the operator owns, plus whatever it can bundle onto that wire — mobile service bought wholesale from a national carrier, television programming licensed from studios and broadcasters, voice, and advertising inventory. Charter describes itself as a broadband connectivity company with services available to 58 million homes and businesses across 41 states under the Spectrum brand [1].
The economics are almost entirely arithmetic on three numbers, and the vocabulary is worth fixing before anything else:
Passings are the homes and businesses the network physically reaches, whether or not they buy anything. Penetration is the share of passings that buy at least one service. A customer relationship is one billed household or small business, however many products it takes; a household buying internet, mobile and video is one relationship, not three. ARPU is monthly revenue per relationship. Revenue is passings times penetration times ARPU. Because the network is already built and staffed, most of the cost sits ahead of the first customer, so an incremental relationship carries a high margin and a lost one takes most of its revenue straight out of profit.
Two further terms recur across every filing in this industry. An operator that resells a national carrier's wireless network under its own brand is a mobile virtual network operator, or MVNO — Charter runs Spectrum Mobile on Verizon's cellular network, supplemented by 49 million of its own out-of-home WiFi access points, and signed a separate multi-year agreement with T-Mobile in July 2025 to carry its business mobile customers from 2026 [2]. An operator that packages and delivers linear television is a multichannel video programming distributor, or MVPD; a streaming service that does the same thing over someone else's broadband is a virtual MVPD, and Charter's filings name YouTube TV, Hulu Plus Live TV, Sling TV, Philo and DirecTV Stream in that category [3].
Estimated Passings (000s)
Customer Relationships (000s)
Penetration of Passings
Monthly Residential ARPU
Source: Q2 2026 quarterly results, unaudited summary of operating statistics, as of June 30, 2026 [4].
The physical asset behind those numbers is a hybrid fiber-coaxial network: fiber from the headend to a neighbourhood node, coaxial cable from the node into the home. Charter runs DOCSIS 3.1 with 750 megahertz or more of bandwidth across effectively the whole footprint, is expanding to 1.2 gigahertz, and plans DOCSIS 4.0 and 1.8 gigahertz after that; it also holds 210 Citizens Broadband Radio Service priority access licences it intends to use for its own targeted 5G small cells [5]. The relevance for an investor is that upgrading coax is a module-and-amplifier job rather than a rebuild, which is the cost structure the whole industry argument turns on.
Where the revenue sits, and who takes it out
Charter's revenue splits into seven reported lines, and the four-year record shows the shape of the industry changing underneath a flat top line.
Sources: FY2023 Form 10-K, revenues by service offering [6]; FY2024 Form 10-K [7]; FY2025 Form 10-K [8].
Total revenue moved from $54.0 billion in 2022 to $54.8 billion in 2025, a rounding error over four years. Inside it, internet revenue rose from $22.2 billion to $23.8 billion and mobile service revenue more than doubled from $1.7 billion to $3.8 billion, while video fell from $17.5 billion to $13.7 billion, voice from $1.6 billion to $1.4 billion, and advertising from $1.9 billion to $1.5 billion [9] [10]. Advertising is also structurally lumpy: the filings state that US advertising revenue is cyclical, benefiting in even-numbered years from advertising related to candidates running for political office [11]. The 2025 decline of $312 million was attributed primarily to lower political revenue [12].
The customer-count series says the same thing in units, and shows the two-sided nature of the shift. Note the definitional break: Charter revised its customer statistics in the fourth quarter of 2025 to include mobile-only customers and to change certain mobile-line reporting policies, restating prior periods; the 2021 to 2023 figures below are as originally reported in each year's Form 10-K, and the 2024 figures are the restated comparatives carried in the FY2025 Form 10-K [13].
Sources: FY2021 Form 10-K customer statistics [14]; FY2023 Form 10-K [15]; FY2025 Form 10-K [16].
Mobile lines went from 3.6 million at the end of 2021 to 11.8 million at the end of 2025 while video fell by 3.2 million and voice by 3.9 million; internet customers peaked in 2023 at 30.6 million and were 29.7 million by the end of 2025 [17] [18].
The value chain
The dollar a household pays does not stay with the network operator. Four counterparties take a defined slice before it reaches profit, and each has its own bargaining structure.
Sources: FY2025 Form 10-K, Programming and Competition [19]; Residential Services [20]; Regulation — Pole Attachments and Franchise Matters [21]; Regulation — Internet Service [22]; Operating costs and expenses [23].
The programming slice is the one that has moved most, and it moves in the operator's favour only because the underlying product is shrinking.
Sources: FY2021 Form 10-K [24]; FY2023 Form 10-K [25]; FY2025 Form 10-K [26].
Programming fell from 38% of total operating costs in 2021 to 27% in 2025 [27] [28]. Per-subscriber rates did not fall; the subscriber base did, and the mix moved to cheaper packages. On the rate side the pressure still runs the other way: Charter's filings state that media and broadcast-station consolidation "has resulted in fewer suppliers and additional selling power on the part of programming suppliers" [29], and that a federal court decision permitting further consolidation of top-four broadcast stations in local markets "will likely result in increases in the rates for retransmission consent" [30].
Sizing the arena
No independent market-size study is available in this run's source record — the external research feed returned nothing — so the sizing below is bottom-up from filings, in US dollars, on the dates each filing states. It measures Charter's addressable footprint, not the US broadband market as a whole, and should not be read as a national total.
Charter's own footprint was 58.98 million estimated passings at 30 June 2026, of which 53.4% bought at least one service, against 55.7% a year earlier [31]. Cox Communications, the private operator Charter agreed to combine with in May 2025, adds about 12 million passings, 6.3 million customers and 5.9 million internet customers, on $13.1 billion of 2024 revenue [32]. On the Q2 2026 call management framed the combined entity as roughly 1.3 million miles of network, over 70 million passings, approximately 37 million customers, approximately $67 billion of revenue and approximately $28 billion of EBITDA — leaving "a selling opportunity of nearly 35 million passings without a relationship today" [33].
The wireless opportunity inside the same wire is stated in the same remarks: approximately 164 million mobile lines exist inside that footprint, of which about 13 million would be Spectrum Mobile — 8% penetration [34]. That ratio is the arithmetic behind every convergence argument in this industry: the fixed-line operator is a rounding error in mobile and a majority share in broadband, and the national carriers are the mirror image.
These are management's own pro forma figures for a transaction that had not closed at the time of the statement, presented in a call rather than audited accounts. They size an opportunity; they are not a market study.
Who competes, and on what
Five categories of competitor appear across Charter's filings, and they attack different parts of the bundle.
Sources: FY2025 Form 10-K, Competition [35] and [36]; FY2024 Form 10-K, Competition [37]; Cox transaction proxy, selected companies analysis [38]; Q1 2026 earnings call [39].
Charter discloses its wireline overlap every year, which makes the encroachment measurable rather than anecdotal. The measurement basis changed, and the comparison has to respect that: through FY2023 the disclosure used a 25 Mbps threshold; from FY2024 it uses the FCC's 100 Mbps definition. The two eras are not comparable.
Sources: FY2021 Form 10-K [40]; FY2022 Form 10-K [41]; FY2023 Form 10-K [42]; FY2024 Form 10-K [43]; FY2025 Form 10-K [44].
Two features of that chart carry information. First, on the consistent 100 Mbps basis the total named wireline overlap rose from 40% of the footprint in FY2024 to 43% in FY2025 [45] [46]. Second, Frontier disappears from the FY2025 disclosure and Verizon's overlap jumps from 6% to 16%; the filing does not explain the reclassification, but the same proxy that lists cable precedent transactions records Verizon's acquisition of Frontier Communications Parent as announced in September 2024 [47]. Wireless overlap is separate and not disclosed as a percentage: the filings say only that several national mobile operators offer cell-phone home internet across Charter's markets [48].
The competitive weapon operators reach for is the bundle price. Charter's January 2026 investor deck sets a gigabit internet line plus two mobile lines at $100 a month against four competitor packages priced between $196.10 and $199.67, and contrasts marketed availability of 100% of the Charter footprint with "capacity dependent" availability for the two 5G home-internet offers [49]. That is a company's own framing of its own price advantage, not a neutral survey — but the availability row is the structural point, and it is the same point in every filing: a cable operator sells convergence everywhere it has plant, and a fixed-wireless operator sells it where a cell site happens to have spare capacity.
Peer economics, and what the record can and cannot support
Two operators' financial statements sit side by side inside Charter's own filings: Charter's, and Cox Communications', whose accounts were filed inside the transaction proxy. Annual reports for Comcast, Altice USA, AT&T, Verizon, T-Mobile and Cable One are also in this run's record, but each reports on its own segment and non-GAAP basis rather than a common US cable-systems definition, so no like-for-like margin table across the industry is assembled here. The comparison below is therefore two operators deep, and the multiple range beneath it is the only cross-industry market data this chapter draws on.
Sources: FY2025 Form 10-K, Adjusted EBITDA reconciliation [50] and customer statistics [51]; estimated passings per the Form 10-K introductions [52] [53]; Cox Transactions proxy, Cox Communications results of operations [54] and [55]; Cox operating statistics [56].
Both operators define adjusted EBITDA their own way and both say so; Charter's definition excludes stock compensation and Cox's disclosure carries the standard non-GAAP caveat, so the margin gap of roughly three percentage points is indicative rather than precise. What is not ambiguous is the direction: Cox's revenue fell in 2023 and again in 2024, and its adjusted EBITDA fell alongside — from $5.22 billion in 2022 to $4.94 billion in 2024 — with a further 4% revenue decline in the first quarter of 2025 attributed partly to the cancellation of the Affordable Connectivity Program [57] [58]. Two operators of very different size reported the same shape at the same time.
For the wider industry, the only cross-company market data in the record comes from the fairness opinion prepared for the Cox transaction. Charter's adviser found only two publicly traded companies it deemed similar to Cox Communications — Comcast and Altice USA — and their enterprise value to 2025 estimated adjusted EBITDA multiples ranged from 5.6 times to 6.9 times on market data as of 14 May 2025 [59]. A public peer set of two is itself a fact about this industry: consolidation has removed most of the comparables.
Charter's own compensation committee benchmarks against a wider primary peer group spanning connectivity and media — AT&T, Cisco Systems, Comcast, EchoStar, Fox, Liberty Global, Lumen Technologies, Netflix, Paramount Skydance, T-Mobile, Verizon, Walt Disney and Warner Bros. Discovery [60]. That list is chosen for pay benchmarking, not business comparability, and it mixes network owners with pure content companies; it is useful as a map of who the company considers adjacent, not as an economics peer set.
Structural conflict lines
Six forces divide this arena. Each is documented in the filings rather than inferred.
Sources: FY2025 Form 10-K — Programming and Competition [61], Video Competition [62], Retransmission Consent [63], Internet Service regulation and subsidies [64], Residential Services [65]; January 2026 investor presentation [66].
Two of these deserve a note on how they actually bind. The MVNO relationship is not simply a cost line: an operator lowers it by moving traffic off the host network onto its own WiFi and CBRS spectrum. Charter reported offloading 88% of mobile traffic, moving toward 89%, before a deliberate product change that improved service above certain caps pushed measured offload back to 87% — and management noted Comcast reporting 90% on the same measure [67]. The offload rate is the single number that determines whether a cable MVNO is a reselling arrangement or a network business.
Regulation binds mostly through cost and timing rather than price. Pole attachment rates are federally regulated in 26 states and self-regulated in 23; the federal rules do not reach poles owned by electric cooperatives or municipal utilities, and Charter states plainly that in rural builds "broadband providers need to access multiple poles per home, as opposed to multiple homes per pole in higher-density settings" [68] [69]. That sentence is the whole rural-build cost problem in one line.
Where the cycle sits
The industry's cycle is visible in one series: quarterly net additions of internet customers. It turned in the fourth quarter of 2023 and has not turned back.
Sources: quarterly earnings releases, unaudited summary of operating statistics — 3Q22, 2Q23 and 3Q23 [70]; 4Q22 and 1Q23 [71]; 1Q24 and 2Q24 [72]; 4Q23, 3Q24 and 4Q24 [73]; January 2026 investor presentation for the 2025 quarters on the revised basis [74]; Q1 2026 [75] and Q2 2026 releases [76]. The 2025 quarters and the fourth-quarter 2024 mobile figure are stated on the revised customer-reporting basis adopted in the fourth quarter of 2025.
Three readings sit in that picture. Internet net additions were positive in every quarter through the third quarter of 2023, went negative in the fourth, and have been negative in all ten quarters since, with the worst prints in the fourth quarter of 2024 and the second quarter of 2026. Mobile line additions peaked at 686,000 in the first quarter of 2023 and have decelerated to roughly 400,000 a quarter. Video losses peaked at over 400,000 a quarter in the first half of 2024, then narrowed sharply and turned positive in the fourth quarter of 2025 — the only one of Charter's product lines to reverse — after Charter rebundled programmer streaming applications into its television packages [77] [78]. Management framed those applications as more than $100 of monthly retail value carried inside the seamless entertainment packages at no additional cost to the customer [79].
Management's own attribution of the downturn changed across the period, and the changes are worth tracking because they are the industry's live diagnosis of its own cycle.
Sources: Q4 2023 call [80]; Q2 2024 Form 10-Q Management Discussion and Analysis [81]; Q4 2024 call [82]; Q1 2025 call [83]; Q4 2025 call [84]; Q1 2026 call [85]; Q2 2026 call [86].
The attribution has migrated from competition to macro. In January 2025 the framing was competitive and the expectation was improvement: management said "it seems we have reached the peak impact from mobile Internet, and we expect a declining pace of fiber overbuilding" [87]. A year later the same executive put the weight elsewhere: "The bigger issue over the past three years is the macro environment in terms of housing, low moves" [88]. By April 2026 the diagnosis was that yield at the point of sale was as strong as ever and churn at historical lows, with the problem at the top of the funnel against "a continued muted housing environment, slow household formation and low move rates" [89]. Both readings can be true at once, and the record does not settle which dominates; a reader tracking this industry should watch whether internet net additions recover before or after US household mobility does.
A discrete regulatory event sits inside the downturn and complicates every year-on-year comparison through 2024 and 2025. The Affordable Connectivity Program, created by Congress in 2021 to subsidise broadband for low-income households, ended during 2024; Charter's 10-Q filings name it alongside lower move rates and competition as the reason internet customer growth was challenged in each of the first three quarters of 2024 [90], and Cox's own filed accounts attribute part of its first-quarter 2025 revenue decline to the same cancellation [91]. Two independently reporting operators, one public and one private, recorded the same subsidy withdrawal in the same period.
Capital intensity and consolidation
The industry's response to flat units has been to spend more on the network and to buy each other.
Source: derived from reported financials; capital expenditure and revenue per the FY2025 Form 10-K, Management Discussion and Analysis [92].
Capital expenditure ran at $11.7 billion in 2025 against $11.3 billion in 2024, with roughly $11.4 billion guided for 2026 [93]. The mix matters for anyone reading a cable balance sheet: of the 2025 total, $7.7 billion was capital excluding line extensions — customer premise equipment, scalable infrastructure, upgrade and rebuild, and support capital — and $3.9 billion was line extensions, of which $2.2 billion went to subsidised rural construction [94]. Line-extension spend buys new passings; upgrade spend buys speed on existing ones. They are different businesses inside one capex line, and the industry's disclosure convention under NCTA guidelines keeps them separate for exactly that reason.
The consolidation record is unusually legible because Charter's own transaction proxy lists the comparable deals its adviser used.
Sources: Cox Transactions proxy, selected precedent transactions analysis [95]; Cox transaction terms [96].
The prices attached to that list are the clearest measure of how the industry has been repriced. Across the six precedent transactions the adviser reviewed, transaction value to trailing adjusted EBITDA had a median of 9.4 times and a range of 7.6 to 10.9 times [97]. The Cox transaction was struck at an enterprise value of $34.5 billion, which management stated equated to 6.4 times Cox's 2025 transaction-adjusted EBITDA — and noted was equal to Charter's own trading multiple on the same basis at the time [98]. Cable assets that changed hands near 9 to 11 times a decade ago now change hands near 6, and buyer and seller agreed on that number.
Alongside the Cox combination, Charter agreed in November 2024 to acquire Liberty Broadband, whose principal asset was approximately 41.5 million Charter shares, with Liberty Broadband's Alaskan operating business spun off separately before closing [99]. Both transactions were expected to close contemporaneously.
Three currents to carry into the rest of this report
Units are shrinking while price carries revenue. Across 2025 Charter's residential internet revenue rose $405 million: a $785 million gain from rate and product mix against a $380 million loss from fewer average customers [100]. That is the industry's present operating mode: volume down, rate up, revenue roughly flat. It works while churn stays low and stops working if price rises start driving churn — which is why the retention-offer episode of early 2026, where more aggressive offers pressured ARPU without producing the expected volume lift, is the kind of event worth tracking [101].
Growth has moved to a product the operator does not own the network for. Mobile service revenue grew 22.0% in 2025 to $3.8 billion and residential mobile lines rose 1.8 million [102], on capacity bought from Verizon and, from 2026, T-Mobile [103]. At 8% penetration of the mobile lines inside the footprint [104] the runway is long, and the economics of that runway are set by the offload rate and by wholesale terms the operator renegotiates rather than controls.
Capital intensity and consolidation are rising together. Capex has gone from 14.8% of revenue in 2021 to 21.3% in 2025 while the number of independent US cable operators has fallen far enough that a fairness opinion could find only two listed comparables [105] [106]. Scale is the stated answer to both the spending and the competition, and the transactions in flight are the industry testing that answer in public.
For how these forces have played out between the named rivals and this company specifically, see Competition; for how Charter itself arrived at this position, see History.
The contested map
Charter sells connectivity to 58 million homes and businesses across 41 states under the Spectrum brand [1]. It does not compete for those homes against one rival on one axis. Its own filings describe five distinct contests, each with a different named opponent set: residential Internet against fiber-to-the-home builders and fixed wireless carriers; mobile against the three national network operators; video against satellite, virtual MVPDs and programmer streaming apps; voice against wireless substitution; and commercial services against telecom carriers, metro fiber operators and managed-service providers [2] [3].
Two features of this run's evidence base shape what follows. First, Charter quantifies its own overbuild exposure: the 10-K states, every year, what share of its operating footprint each named terrestrial broadband rival reaches. That is an unusually direct disclosure and it forms the spine of this tab. Second, this tab reads the contest from Charter's side of it: everything attributed to a rival below is sourced from Charter's filings, exhibits and calls, and is labelled as such. Two rivals speak in their own voice here. Cox Communications' audited financial statements and its own business-and-competition description are filed inside Charter's Cox merger proxy, so a genuine cable peer's numbers are on the record. And AT&T's own 10-K is used once below, where it puts a figure on a product Charter's management describes but does not size. The rivals' 10-Ks and transcripts — AT&T, Verizon, T-Mobile, Comcast, Altice USA and Cable One — are indexed in this run and read in Competitors; arena structure and value-chain economics belong to Industry.
Passings (000s, 2Q26)
Customer Relationships (000s)
Penetration of Passings
Footprint Reached by AT and T
Footprint Reached by Verizon
Sources: 2Q26 trending schedule, Customer Metrics [4]; FY2025 Form 10-K, Competition [5].
Who competes where
The clearest company-authored roster of rivals is not in the 10-K. It is Schedule 1 to Charter's executive employment agreements, which enumerates, product line by product line, the companies Charter's own employment agreements name as competitors for non-compete purposes: video and Internet access on the first page [6], voice and data, wireless and advertising on the second [7]. The table below maps the principal names from that schedule against the segments described in the FY2025 10-K.
Sources: Employment Agreement Schedule 1, video and Internet activities [8] and voice, wireless and advertising activities [9]; FY2025 Form 10-K, Competition [10] [11].
One entry in that table carries a structural complication. Verizon is both the rival whose fiber reaches the largest share of Charter's footprint after AT&T and the carrier whose cellular network Spectrum Mobile rides: Charter's mobile service leverages "the cellular network of Verizon Communications Inc." for nationwide coverage, including 5G and international roaming [12]. Comcast sits in a similar double position: named in the Internet, video, voice and advertising schedules, and in 2025 a counterparty that agreed to carry Spectrum News to its own video customers in California, Connecticut, northern New Jersey, Orlando and Tampa [13].
The overbuild Charter measures
Every 10-K since FY2021 states the share of Charter's operating footprint reached by its named terrestrial broadband rivals. The series is not continuous: the FY2024 filing raised the speed threshold from 25 Mbps to the FCC's 100 Mbps definition, which mechanically cut the reported percentages, and the FY2025 filing stops naming Frontier at all while Verizon's disclosed reach jumps from 6% to 16%.
Sources: FY2021 Form 10-K [14]; FY2022 [15]; FY2023 [16]; FY2024 [17]; FY2025 [18]. FY2021–FY2023 measured at 25 Mbps and above; FY2024–FY2025 at the FCC's 100 Mbps definition.
Three facts sit in that chart. Combined disclosed reach of the named FTTH rivals was 48 points of footprint in FY2021 and 43 points in FY2025, but the FY2024 threshold change makes the two ends non-comparable; on the consistent 100 Mbps basis the total moved from 40 points in FY2024 to 43 in FY2025. Frontier was named a primary FTTH competitor in each filing from FY2021 through FY2024 [19] and does not appear anywhere in the FY2025 10-K. In the same filing Charter writes that "consolidations in the telecom industry continue to increase competition as they seek to offer converged connectivity services similar to ours" [20]. The filings do not state that Frontier's overlap moved into Verizon's line; the disclosure change and the 10-point rise in Verizon's reported reach are what the record shows.
Fixed wireless is disclosed differently — by presence rather than by percentage. The FY2022 and FY2023 10-Ks described "several national mobile network operators" offering LTE or 5G home Internet "in our markets" [21] [22]; the FY2024 filing renamed the product "cell phone home Internet service (fixed wireless access from cell phone towers)" [23]. Speaking to investors in May 2025, Charter's CEO put the mobile-broadband overlap at the maximum: "we have AT&T, Verizon, T-Mobile in 100% of our footprint. We have satellite everywhere we operate" [24]. AT&T's own 10-K sizes its side of that product: 1.5 million AT&T Internet Air connections at December 31, 2025, of which 875,000 were added during the year [25]. Neither company discloses how much of that base sits inside Charter's footprint.
Cox: a peer's own numbers
Cox Communications is the rival that speaks most fully in its own voice in this corpus, because Charter's merger proxy carries Cox's audited financial statements and Cox's own description of its business and its competition. Cox describes itself as "the largest private broadband company in the United States," operating fiber-powered networks in more than 30 states [26]. It runs the same model as Charter: HFC and fiber broadband, video, a commercial division, an advertising sales arm, and a mobile product provided under Cox's own MVNO rights over a major network operator's wireless network [27].
Source: Cox Communications, Inc. audited Consolidated Statements of Operations, filed in Charter's Cox transaction proxy [28].
Cox's revenue fell in each year of the audited series, from $13,542 million in 2022 to $13,073 million in 2024, and its operating income fell 15% in 2024 to $2,550 million [29]. Cox's own Adjusted EBITDA was $5,065 million in 2023 and $4,939 million in 2024, on the definition Cox uses [30]. In the first quarter of 2025 Cox revenue fell 4% year over year to $3,183 million while Adjusted EBITDA was flat at $1,261 million [31].
Sources: Charter FY2025 Form 10-K, revenue and Adjusted EBITDA [32]; Charter 2Q26 trending schedule, 1Q25 customer metrics [33]; Cox audited statements [34] and MD and A [35]; Cox customer counts as of March 31, 2025 [36]; passings and customers per the May 2025 transaction presentation [37]. Charter and Cox Adjusted EBITDA are each company's own non-GAAP definition and are not stated to be computed alike. The 1Q25 passings and customer figures are the transaction presentation's, on Charter's pre-revision customer-statistic basis; on the revised basis used elsewhere on this tab Charter's 1Q25 relationships were 32,160 thousand [38].
Cox's own competition section names the same opponents Charter names, in the same order of prominence: "AT&T, Lumen, Verizon, Frontier, and other fiber overbuilders, small incumbent local exchange carriers, and municipal and utility-owned providers" in broadband; DirecTV and Dish in video; "AT&T, T-Mobile, Verizon, and Dish" for Cox Mobile [39] [40]. Charter is not among them. That absence is the point Charter's CEO makes about the deal: "We don't have any real overlapping footprint between the 2 companies" [41]. Two US cable operators of this size are not rivals for the same household; they are rivals for the same national business accounts and the same advertising budgets, two of the lines on which Charter's own non-compete schedule names Cox [42].
Cox Enterprises is to receive $21.9 billion of consideration [43]; Charter is obligated to fund $4.0 billion of cash and expects to assume approximately $12.6 billion of Cox net debt and finance leases [44]. On the July 2026 call, management said it was "now hoping to close in mid- to late August" [45]. On the same competitive read Charter applies to itself, it describes the Cox footprint as "over 50% overbuilt with fiber," and "not that dissimilar from Charter" [46].
Where the units are moving
Charter's product-unit record separates cleanly into three trajectories. Internet peaked at 30.6 million customers at the end of 2023 and has declined since; video has fallen in every year shown; mobile lines have more than tripled.
Sources: FY2021 Form 10-K [47]; FY2022 [48]; FY2023 [49]; FY2024 [50]; FY2025 [51]. Charter revised its customer-statistic definitions in 4Q25; on the revised basis 2024 Internet customers were 30,083 and mobile lines 9,858.
Penetration of Charter's own passings is the measure least affected by definition changes, because both numerator and denominator come from the same schedule. It has fallen in every quarter since the start of 2024 while the footprint kept growing.
Source: 2Q26 trending schedule, Customer Metrics [52].
Passings rose from 55.7 million to 59.0 million over those ten quarters — roughly 3.3 million new homes, of which the subsidized rural build accounts for part — while relationships fell from 32.6 million to 31.5 million [53]. Charter has spent $7.7 billion since 2022 on that rural initiative and activated approximately 1.3 million passings, with over $2 billion of support awarded through RDOF and other federal, state and municipal grants including BEAD [54].
The quarterly net-addition series shows the three products moving in different directions at the same time.
Source: 2Q26 trending schedule, Customer Metrics [55].
Video net additions turned positive in 4Q25 for the first time in the series, at 44,000, after Charter completed deals with major programmers to include streaming applications in Spectrum TV packages at no additional cost and launched the Spectrum App Store [56]. Mobile net additions fell in seven consecutive quarters from the 2Q24 peak of 552,000 to 368,000 in 1Q26, before recovering to 406,000 in 2Q26. Internet losses widened again in 2026: 172,000 in the second quarter, which management described as "higher than a year ago, similar to what we saw in the first quarter," attributing it to soft gross additions rather than churn — "Softer gross additions remains the primary driver of our Internet customer growth weakness, while churn remained largely unchanged" [57].
Price and revenue by contested product
Revenue by product line separates the price effect from the unit effect. Internet revenue rose through 2025 on rate while units fell, then turned down in 2026; video revenue has fallen in eight of the ten quarters; mobile service revenue has risen every quarter.
Source: 2Q26 trending schedule, Revenue, Expenses and Adjusted EBITDA [58].
Monthly residential revenue per customer peaked at $120.07 in 1Q25 and was $117.52 in 2Q26 [59]. Charter's pricing response to the mobile-network operators is explicit and named: management says it runs "a savings guarantee against AT&T, T-Mobile and Verizon; we guarantee $1,000 of savings," and that competitors offering savings guarantees "don't do that against us" [60]. The same $1,000 guarantee, plus price locks available when mobile and video are included, was described as a driver of net promoter score in July 2026 [61].
Share in fiber-overlap markets: what is disclosed and what is characterized
Charter does not publish market share. It characterizes it. The distinction matters because the two categories of statement below are of different evidentiary weight: the unit and revenue series above are disclosed; the share statements are management's description of internal data that is not in the filings.
Sources: Q1 FY2025 call [62]; DEFA14A May 16 2025 [63]; Q4 FY2025 call [64]; Q1 FY2026 call [65]; Q2 FY2026 call [66].
The most specific of these is the FY2025 call, where management put a magnitude on a new overbuild: the impact "tends to be limited to a few percentage points of Internet penetration during the first year of a new overbuilt vintage," and added that Charter does "not see overbuilders reaching their ROI goals within our footprint now or in the future" [67]. Against that, the disclosed series shows penetration of passings falling 5.1 points across ten quarters while the named rivals' disclosed reach rose. Both statements can hold at once — new-vintage overbuild is incremental, and the cumulative stock of overbuilt homes is what moves the penetration line — but the filings do not disclose the split, and Charter never publishes its own penetration inside those overlap markets. No rival reports its results on Charter's footprint either, so the claim cannot be checked against a disclosed number from any side.
On satellite, the company's read as of April 2026 was that "our tracking in data doesn't suggest a significant customer share loss to satellite," with the qualification that "in some subsidized rural markets, we may have seen satellite precede us" [68].
The terms that govern switching
Charter's residential business is structured to make leaving easy and to pay for arriving. The filings disclose no minimum term for residential connectivity; the contractual friction sits in device financing, bulk property agreements, commercial contracts and the municipal franchise.
Sources: FY2025 Form 10-K — products and customer commitments [69]; pricing, device plans, Phone Balance Buyout and community agreements [70]; Verizon MVNO [71]; franchises [72]; commercial contract terms and revenue recognition [73]; bulk MDU unit counting [74]; programming and app inclusion [75].
Two of these terms run in opposite directions. The Phone Balance Buyout program pays down balances on lines ported in from another carrier, which lowers the cost for a rival's customer to switch to Charter [76]. The franchise structure runs the other way for Charter: franchises are non-exclusive, granted for fixed terms and subject to renewal, and franchising authorities "can grant additional franchises to competitors in the same geographic area or operate their own cable systems" [77].
Where switching cost does appear in Charter's own numbers, it is behavioural rather than contractual. Management quantified it in July 2026: Internet customers who also buy mobile "churn nearly 40% less" than those who do not, and Internet customers who buy video "churn over 40% less"; mobile penetration of Internet customers was about 20%, at just under two lines per mobile customer [78]. Of eligible video customers, 55% had activated at least one included streaming app, averaging more than four apps [79]. Those are retention statistics disclosed on a call, not terms in a contract, and no contract in this corpus binds a residential customer for a period.
Evidence gaps in this record
Three limits are worth stating plainly for anyone building on this tab. Almost every figure attributed to AT&T, Verizon, T-Mobile, Comcast, Frontier or the satellite and streaming names above comes from Charter's own filings, exhibits or calls; the exceptions are Cox, whose audited statements are filed within Charter's merger proxy, and AT&T's fixed wireless connection count above. The rivals' own 10-Ks and transcripts are indexed in this run and are read in Competitors, but none of them reports results on Charter's footprint, so they cannot settle a share question inside it. The web-research phases for this run did not complete, so no external market-share series is available. And Charter revised its customer-statistic definitions in the fourth quarter of 2025, adding mobile-only customers and a connectivity-customer measure and restating prior periods; the multi-year unit chart above therefore joins two definitional bases, with the revised 2024 figures noted in its caption [80].
The record and its breaks
Charter's documented record runs from a 1999 initial public offering, through a 2009 Chapter 11 reorganization, a 2016 merger that quadrupled its size, a decade of buybacks, and — from 2022 — a capital-spending cycle that ran alongside the first sustained decline in its broadband customer base. This tab records what happened and when, what management said would happen, and how the explanations changed. It does not argue what any of it means; the chapters do that.
The corpus documents four periods at very different resolution. The founding-to-listing era survives in the 1999 prospectus. The 2009 restructuring and the 2014–2016 deal sequence survive as agreements and exhibits. Fiscal 2021 through fiscal 2025 are covered by five Forms 10-K. The period from the third quarter of 2023 to the second quarter of 2026 is covered call by call, and that is where the said-versus-did record is densest.
Three breaks define the sequence. The first is May 2016, when Time Warner Cable and Bright House closed and Charter became a national operator [1]. The second is 2022, when capital expenditure began climbing from 14.8% of revenue toward 21.3% while buybacks fell from $15.43 billion in fiscal 2021 to $1.21 billion in fiscal 2024. The third is the eighteen months from November 2024, when Charter agreed to absorb Liberty Broadband [2] and then Cox Communications [3], rewrote its leverage policy, and paused the buyback. Over the same stretch the equity fell 68.2% from its trailing three-year high, to a market capitalisation of $19.97 billion on 31 July 2026.
Class A listing
Repurchased since Sept 2016 ($B)
FY2025 capital spend ($B)
Straight quarters of Internet losses
Sources: 1999 IPO prospectus [4]; FY2025 Form 10-K, Liquidity and Capital Resources [5]; Q4 FY2025 earnings call [6]; Q2 FY2026 earnings call [7].
The arc in dated beats
The sequence below weights events by consequence, not by column inches. Where a document in the corpus establishes the date, it is cited; where the corpus records only the aftermath, the row says so.
Sources: 1999 IPO prospectus [4] [8] [9]; 2009 restructuring agreement amendment [10]; Comcast transactions agreement [11]; Bright House contribution agreement [12]; TWC merger agreement [13]; FY2021 Form 10-K [1]; FY2025 Form 10-K [14] [5]; Liberty Broadband announcement [2]; Cox Form 8-K [3]; special meeting Form 8-K [15]; A/N notice Form 8-K [16]; officer and director Forms 8-K [17] [18] [19]; exchange offer Form 8-K [20]; Q2 FY2026 earnings call [21].
Who holds those seats and what they are paid today belongs to People; the named-rival record behind the competitive dates belongs to Competition.
Where the money went
The capital-allocation record divides cleanly at 2022. In the six years to fiscal 2021, repurchases exceeded capital expenditure in four of them. From fiscal 2022 the ranking inverts and does not revert: capital expenditure rises every year through fiscal 2025 while the buyback is cut to a fraction of its fiscal 2021 level, recovers partially in fiscal 2025, and is then paused.
Source: cash-flow statements as reported in company filings; free cash flow here is operating cash flow less capital expenditure. Cumulative repurchase disclosure per the FY2025 Form 10-K, Liquidity and Capital Resources [5].
The running total is disclosed in each Form 10-K. Since the programme began in September 2016, Charter had repurchased approximately 179.7 million shares and Charter Holdings common units for approximately $78.8 billion through the end of fiscal 2025 [5]. The same disclosure read $56.8 billion through 2021 [22], $68.5 billion through 2022 [23], $72.0 billion through 2023 [24] and $73.4 billion through 2024 [25]. Diluted share count fell from 193.04 million in fiscal 2021 to 137.74 million in fiscal 2025. Net debt over those same five years moved from $90.96 billion to $94.28 billion.
The transaction ledger records what was bought, what it cost, the stated objective, and what the filings disclose about the outcome.
Sources: 1999 IPO prospectus [4]; merger and contribution agreements [11] [12] [13]; FY2025 Form 10-K [5] [14]; FY2023 Form 10-K on the total rural commitment [26]; FY2025 Form 10-K on government assistance [27]; Liberty Broadband announcement [2]; Cox Form 8-K [3]; Q2 FY2026 earnings call [21].
Two entries in that ledger carry terms the record does not yet close out. The Cox common units were struck at a $353.64 reference price in May 2025, and the convertible preferred carries a 6.875% coupon with an initial conversion price of $477.41 [3]. And the rural initiative is justified by "long-term infrastructure-style returns" with no disclosed hurdle rate and no realised figure [14].
The leverage policy, and when it moved
For four consecutive Forms 10-K the language was identical: target leverage of net debt to trailing Adjusted EBITDA "remains at 4 to 4.5 times Adjusted EBITDA" [22]. The fiscal 2025 filing broke it: "Charter plans to adjust its long-term target leverage range after the Closing to 3.5 to 3.75 times Adjusted EBITDA" [5]. Six months later the target moved again and the buyback stopped. On the July 2026 call the CFO said Charter was "lowering our post-transaction leverage target to a flat 3.5x" and that "we have paused our share repurchases through the end of the third quarter" [21]. In the quarter immediately before the pause, Charter had repurchased 4 million shares for $838 million at an average price of $210.
Two years earlier, asked whether deleveraging would crowd out repurchases, the same executive had said: "we expect to be able to maintain our buybacks over the course of the year even as we delever" [28]. Fiscal 2024 repurchases came to $1.21 billion against $3.21 billion the prior year.
Said versus did
Every fiscal year the corpus covers is accounted for below. Each row names the period promised, the measurement basis, the call or filing where the commitment was made, and the reported result on the same basis.
Sources: earnings calls Q3 FY2023 [29], Q4 FY2023 [30] [31], Q1 FY2024 [32], Q3 FY2024 [33], Q4 FY2024 [34] [35], Q2 FY2025 [36], Q3 FY2025 [37], Q4 FY2025 [38] [6], Q1 FY2026 [39] and Q2 FY2026 [40] [21]; full-year results releases for 2023 [41] and 2024 [42]; Forms 10-K FY2021 [22] and FY2025 [5].
Capital expenditure guidance against outcome
All three years the corpus covers in guidance landed below the number first given, and in each case the explanation offered was timing rather than scope.
Sources: Q4 FY2023 call, where 2024 was guided to $12.2bn to $12.4bn and the midpoint is shown [31]; Q4 FY2024 call for the 2024 outcome and the 2025 guide [35]; Q2 FY2025 call for the 2025 revision [36]; Q4 FY2025 call for the 2025 outcome and the 2026 guide [6].
The year in which spending was to normalise moved once. In February 2024 the CFO said Charter expected "CapEx spend of just over $12 billion in 2024 to fall to approximately $8 billion by 2027" [31]. In January 2026 the same commitment read: "We expect to revert to normalized CapEx in the range of $7.5 to $8 billion per year by 2028" [43].
The customer record
The Internet base peaked at 30.588 million at the end of 2023 and has declined in every quarter since. Video has fallen every year in the record; mobile lines have risen every year; voice has more than halved since 2020.
Sources: customer statistics tables in the FY2021 [44], FY2022 [45], FY2023 [46], FY2024 [47] and FY2025 [48] Forms 10-K, each on the basis reported in that year; the FY2025 restatement is set out in the definitions table below.
Read quarterly, the turn is sharper. The last quarter of Internet growth was the third of 2023.
Sources: quarterly earnings calls Q3 FY2023 [49], Q4 FY2023 [30], Q1 FY2024 [50], Q2 FY2024 [51], Q4 FY2024 [52], Q1 FY2025 [53], Q2 FY2025 [54], Q3 FY2025 [55], Q4 FY2025 [38], Q1 FY2026 [39] and Q2 FY2026 [7]; Q3 FY2024 from the quarterly earnings release [56].
Explanation drift
Management's account of why the Internet base was shrinking changed six times across eleven quarters. The wording is quoted verbatim and dated; the sequence itself is the record.
Sources: Q3 FY2023 [29], Q4 FY2023 [57], Q1 FY2024 [58], Q2 FY2024 [59], Q1 FY2025 [60], Q2 FY2025 [54] and Q2 FY2026 [61] earnings calls.
The vocabulary moved with the explanation. Counting how often each theme is named across the twelve calls shows the Affordable Connectivity Program rising to dominate the July 2024 call and then disappearing entirely by 2026, while Cox goes from unmentioned to the most-named subject on the last two calls.
Source: derived by counting occurrences of each theme's terms across the twelve earnings-call transcripts in the corpus, from Q3 FY2023 [49] through Q2 FY2026 [61].
One commitment survived the whole period with its wording nearly intact. "We expect to return to a more normalized Internet growth over time" in February 2024 [57] becomes "we remain confident that we'll return to Internet customer growth over time" in July 2025 [54] and "Internet customer growth is taking longer to reverse" in July 2026 [61]. The commitment holds; the horizon is never dated.
Definitions that moved
Three measurement bases changed inside the covered period. Each affects a comparison a reader is likely to make.
Sources: FY2022 [45] and FY2023 [46] Forms 10-K; FY2025 Form 10-K, Products and Services [62] and customer statistics [48]; FY2025 Form 10-K, Use of Adjusted EBITDA and Free Cash Flow [63].
Where the record is thin
Four gaps are worth naming rather than smoothing over.
No Form 10-K before fiscal 2021 is in the corpus. The 2016 merger's own reporting year, the integration years, and the peak-buyback years of 2017 to 2020 are reconstructed here from cash-flow data and from the cumulative repurchase disclosure carried forward in later filings, not from the filings that first reported them.
No earnings-call transcript before the third quarter of 2023 is in the corpus. Guidance given for fiscal 2021, 2022 and 2023 cannot be checked sentence by sentence; the fiscal 2023 rural-passings target is recoverable only because it was restated on the October 2023 call [29].
No realised return is disclosed for the rural construction initiative. The filings give the spend, the passings and the subsidy awards — $7.7 billion, 1.3 million passings, $1.1 billion of federal RDOF subsidy and roughly $1.7 billion of publicly awarded state grants [27] — but not a return against the standard the programme was justified by.
Neither the Cox nor the Liberty Broadband transaction had closed as at the last document in the corpus. Charter told investors in July 2026 that it was "hoping to close in mid- to late August" [64]. The first post-close quarterly results were to carry a full quarter for legacy Charter plus a stub period for legacy Cox [65]. Integration outcome, synergy realisation and purchase accounting all sit outside this record.
Control and Incentives at a Glance
Charter is a widely held company with two contractually privileged shareholders. Liberty Broadband held 41,046,352 shares — 29.07% of Class A common stock on an as-exchanged basis — and Advance/Newhouse Partnership held 18,647,794 shares, or 13.21%, as of February 20, 2026 [1]. Measured as voting stock at December 31, 2025, the two held approximately 29.22% and 13.12% [2]. Between them they name five of thirteen directors under a stockholders agreement written in 2015 for the Time Warner Cable and Bright House transactions [3]. Every officer and director combined holds 1.10% [4].
Both privileged positions are contracted to change. Liberty Broadband is being absorbed into Charter and its three designees have agreed to resign at closing; Cox Enterprises is contracted to arrive with roughly 25.1% of diluted equity, three board seats, and a three-year chairmanship [5].
The incentive architecture rests on one instrument. Charter pays its executives principally in stock options, and in February 2023 it granted five years of long-term incentive value in a single award whose vesting turns on stock-price hurdles beginning at $507 [6]. Charter's Class A closed at $208.75 on December 31, 2025 [7] and at $144.98 on July 31, 2026 (daily price series, as reported). What follows is the record: who holds the votes, who sits on which committee, what the plans pay for, and what insiders have done with their own money.
The Control Map
Sources: ownership and board seats from the 2026 Proxy Statement [8] [9], percentages computed on 141,178,369 shares outstanding at February 20, 2026 [10]; voting caps from the description of registered securities [11]. Winfrey's board seat is counted in the officer and director group.
Three mechanics do the work.
The voting cap. Shares held by Liberty Broadband or A/N above the applicable cap must be voted in the same proportion as all other votes cast by public stockholders. The cap for Liberty Broadband is the greater of 25.01%, 0.01% above the highest voting interest of any other person or group, and 23.5%, rising one-for-one to a maximum of 35% for each permanent reduction in A/N's equity interest below 15%. A/N's cap is 23.5% on the same escalator [12].
The mirror-vote obligation. Both holders must vote for the slate nominated by the Nominating and Corporate Governance Committee and against any other nominee. For the eight directors neither holder designated, they must instead vote in the same proportion as unaffiliated stockholders, if voting their own way would change the outcome [13].
The single Class B share. A/N's Charter Holdings units are voted through one share of Class B common stock whose vote count tracks the units. That single share carried 15,824,243 votes at the July 2025 special meeting [14] and 15,511,283 votes at the April 2026 annual meeting [15].
A minority holder therefore votes on equal terms for the eight unaffiliated directors, and can defeat a management proposal only by outvoting a bloc that starts near 42% of the vote and is contractually obliged to support the board's slate.
Source: Charter Form 10-K risk factors, FY2021 [16], FY2022 [17], FY2023 [18], FY2024 [19] and FY2025 [20].
Neither stake was built by buying. Both rose because Charter retired stock faster than the two holders sold into the buyback: Liberty Broadband's voting interest climbed from 27.51% to 29.22% over five years while Charter repurchased shares from it every month.
The Pending Reshuffle
Two signed transactions rewrite the control map. Charter agreed on November 12, 2024 to acquire Liberty Broadband; Liberty has agreed to cause each of its three Charter designees to resign effective immediately prior to that closing [21]. Charter agreed on May 16, 2025 to acquire Cox Communications from Cox Enterprises.
At the Cox closing, board size stays at thirteen; A/N's designees continue; three Cox designees join; and each of Cox Enterprises and A/N may thereafter designate up to three nominees subject to ownership thresholds. Cox Enterprises is capped at 30% for acquisitions and 30% for voting, A/N at 19% and 15% respectively, with excess shares voted in proportion to the public. Alexander C. Taylor, Chairman and CEO of Cox Enterprises, becomes Chairman of Charter's board for an initial three-year term; Eric L. Zinterhofer, the current Non-Executive Chairman, becomes lead independent director; after Taylor's term, Christopher L. Winfrey becomes Chairman [22]. Cox's votes will be carried by one share of a new Class C common stock whose vote count reflects its Charter Holdings units on an as-converted, as-exchanged basis [23].
Winfrey's employment agreement makes that chairmanship sequence a compensable term for him personally: following the Cox closing, the appointment of any Chairman other than Taylor or Winfrey is defined "good reason" entitling him to full severance [24].
Shareholders ratified the structure at a special meeting on July 31, 2025: the share issuance drew 142,421,886 votes for against 83,940 opposed, and the certificate amendment 142,389,018 for against 106,689 [25]. Neither transaction had closed as of June 30, 2026 [26].
Board and Committees
The board has thirteen seats, fixed by the stockholders agreement and the certificate of incorporation. The board designated twelve of thirteen as independent under NASDAQ rules — Winfrey, as an executive officer, is the exception [27]. The disclosure separates that finding from a second one: Messrs. Nair, Patterson and Wargo (Liberty Broadband designees) and Messrs. Miron and Newhouse (A/N designees) "may not be considered independent under SEC rules for Audit Committee membership purposes" because of their designation by or relationship with a stockholder [28]. Seven of thirteen directors are independent of both management and both designating shareholders.
Sources: 2026 Proxy Statement director nominee biographies and committee assignments, pp.10–18 [29] [30] [31] [32] [33] [34] [35] [36] [37].
Observable features of that table, separate from the disclosed designations:
- Tenure is long at the core. Conn has served since 2004, Zinterhofer and Markley since 2009, Nair since 2013. Three of the thirteen joined in 2025 or 2026 [38].
- Committee work concentrates. Zinterhofer sits on three committees and Conn, Markley, Newhouse, Patterson and Ramos on two; Nair, Davis and Winfrey sit on none [39].
- The Audit Committee is the one shareholder-free room. Neither A/N nor Liberty Broadband has designated a director to the Audit Committee, but each has designated an observer [40].
- Overlapping affiliations exist among the unaffiliated. Zinterhofer is a director of Liberty Latin America and TelevisaUnivision [41]; Wade Davis is Vice Chairman of TelevisaUnivision and its former CEO [42]; Nair runs Liberty Latin America [43].
Committee activity in 2025
The full board met sixteen times in 2025 and acted eight times by unanimous written consent; each incumbent director attended at least 75% of applicable meetings [44].
Source: 2026 Proxy Statement, Compensation and Benefits, Nominating and Corporate Governance, Finance and Special Committee disclosure [45] and Audit Committee disclosure [46].
Two structural details sit inside that table. The Finance Committee met once and acted seven times by written consent, and ad hoc committees acted by written consent on the buyback arrangements with A/N and Liberty Broadband — the transactions in which those two shareholders are the counterparties [47]. And during the pendency of the Liberty Broadband merger, Liberty's designees on the Compensation and Benefits Committee do not participate in discussions or decisions on hiring, firing or compensating the CEO and CFO [48].
Thomas M. Rutledge, who retired as Executive Chairman in November 2023, continues as Director Emeritus: he attends board meetings but does not vote on matters presented [49]. He received $344,626 for 2025 in that capacity, having elected his annual director emeritus retainer in equity [50].
Director pay
Non-employee directors received a $120,000 annual retainer in cash or equity by election, plus $225,000 of restricted stock — $375,000 for the Non-Executive Chairman — and per-committee fees of $30,000 (Audit), $25,000 (Compensation), $20,000 (Nominating) and $20,000 (Finance), with chair premiums on top [51]. Special Committee members received $20,000, and its chair $40,000, plus per-meeting fees beyond six meetings [52].
Source: 2026 Proxy Statement, 2025 Director Compensation table [53].
Markley's and Merritt's cash exceeds the Chairman's because Special Committee work is paid in cash and the equity retainer is elective — Zinterhofer, Goodman, Miron, Nair, Ramos and Rutledge took theirs in stock [54]. The 2025 restricted stock was granted April 22, 2025 and vests at the 2026 annual meeting [55].
Audit
KPMG has audited Charter since 2002 — a twenty-four-year tenure that the Audit Committee states it evaluates annually alongside partner rotation [56] [57]. Fees for 2025 were approximately $8 million of audit fees, $1 million of tax fees, $0.1 million of other fees and no audit-related fees; the Audit Committee pre-approved 100% of them [58]. Shareholders ratified the appointment in April 2026 with 131,975,231 votes for and 1,840,776 against [59].
Operators
Sources: 2026 Proxy Statement executive officer biographies for DiGeronimo and Fischer [60] and for Haughton, Howard and Ray [61] [62]; Jeffery appointment from the Form 8-K of February 25, 2026 [63].
The senior team is internally grown and stable. Four of the six Section 16 officers named in the 2026 proxy have been at Charter since 2010 or earlier, and there were no promotions or role changes among the named executive officers in 2025 [64]. Winfrey has held all three of the CFO, COO and CEO seats.
The one structural change is external and dated. On February 25, 2026 Charter announced Nick Jeffery, President and CEO of Frontier Communications from 2021 until its acquisition by Verizon in January 2026, as Chief Operating Officer effective September 1, 2026 — the first person in the role since Winfrey vacated it. His package: base salary of at least $1,500,000, target bonus of 225%, an inducement grant of $20,000,000 of stock options vesting 25/50/25 across September 2028, 2029 and 2030, $500,000 of RSUs vesting September 2029, and annual awards targeted at $11,750,000 [65]. That single option grant is nearly as large as the $23,000,000 annual stock option award the CEO is contracted to receive from 2027 [66].
Board turnover in the same window is documented in dated filings. David C. Merritt notified the board on December 11, 2025 of his intention to retire effective January 26, 2026, stated as not the result of any dispute or disagreement [67]; Wade Davis was appointed the following day, January 27, 2026, with no arrangements or understandings with any other person [68]. Gregory B. Maffei and James E. Meyer left the board on April 22, 2025, replaced by J. David Wargo and Martin E. Patterson respectively [69].
What the Pay Plans Pay For
Charter runs three instruments: a cash annual incentive, an annual option-weighted equity grant, and a once-in-five-years front-loaded performance equity program.
The annual incentive
Payouts range from 0% to 150% of target. For 2025 the plan weighted Adjusted EBITDA at 55%, revenue at 15% and strategic objectives at 30%, with financial threshold and maximum set at 97.5% and 100.5% of target — a band of three percentage points [70].
Source: 2026 Proxy Statement, 2025 Annual Incentive Payout [71].
Both measured financial metrics landed between threshold and target and paid 73.14% and 83.33%. The 30% discretionary component paid 125%, lifting the total to 94.30% [72]. Every named executive received the same 94.30%, from $4,263,146 for Winfrey to $1,025,513 for Ray [73]. The revenue and Adjusted EBITDA figures used for bonus attainment are adjusted: revenue excludes mobile device revenue and is adjusted for over-performance of the seamless entertainment applications, and Adjusted EBITDA excludes that revenue and mobile device expenses [74].
The 2023 Performance Equity Program
In February 2023 the Compensation Committee granted each participant five times their annual long-term incentive value in one award, less what had already been granted that January. Awards were 90% stock options and 10% RSUs, split into eighteen option tranches and twelve RSU tranches, each carrying both a time condition of three to five years and a stock-price hurdle. Six hurdles run from $507 to $1,000, measured on a 60-trading-day average closing price; a tranche whose hurdle is not achieved by the sixth anniversary of the grant — February 22, 2029 — is forfeited. No award vests on any termination except death, disability, or an involuntary termination or good-reason resignation following a change in control, and then only for tranches whose hurdle is already satisfied [75].
Sources: hurdle levels, CAGR equivalents and the February 10, 2023 reference price of $396.94 from the 2026 Proxy Statement [76]; December 31, 2025 close of $208.75 from the same document [77]; July 31, 2026 close from the daily price series, as reported.
The lowest hurdle is $507, or $564 for Winfrey, whose floor was set at the highest hurdle of the 2016 program he participated in [78]. From $144.98 on July 31, 2026, reaching $507 requires the shares to more than triple; reaching Winfrey's $564 requires close to a quadrupling, and the sixth anniversary falls in February 2029.
Source: 2026 Proxy Statement, 2023 Performance Equity Program Award Details, all granted February 22, 2023 [79].
Jamal Haughton did not participate — he joined in November 2023, after the grant — and so receives only annual awards [80].
Strikes against the current price
Charter's own disclosure states that all outstanding stock options granted since May 2016 are underwater, and that the named executives' weighted average strike of $370.69 stood 78% above the December 31, 2025 close of $208.75 [81]. Against the July 31, 2026 close of $144.98, that same weighted average strike is 156% above the market. Across all plans, 17,375,664 options were outstanding at a weighted average exercise price of $387.06 at December 31, 2025, with 9,585,080 shares still available for grant [82].
Source: 2026 Proxy Statement, Outstanding Equity Awards at Fiscal Year End, as of December 31, 2025 [83] [84].
Winfrey also held 59,093 hurdle-gated RSUs from the 2023 program, carried at $12,335,664 on the December 31, 2025 close [85] [86]. The largest exercisable position — 497,309 options struck at $221.25 from the June 2016 performance grant — carried an expiration date of June 17, 2026 [87]. Charter's Class A last closed above that strike on April 23, 2026, at $241.78, and closed at $132.00 on the expiration date (daily price series, as reported).
Contract terms and plan governance
Sources: 2026 Proxy Statement base salary table [88], Compensation Actions in 2025 [89], NEO Employment Agreements and each agreement's initial term [90], and the severance table for termination without cause [91]. Ray's term reflects his agreement effective January 19, 2026 [92]; Haughton's shown term is the agreement in force at year-end 2025.
The CEO package was reset on December 3, 2025, effective December 1: base salary from $1,700,000 to $2,500,000 (a 47.06% increase), target bonus from 250% to 300% of salary, and annual long-term incentive from $17.0 million to $23.0 million, with an initial term through December 1, 2028 [93] [94]. A $6.0 million top-up option grant followed on January 15, 2026, delivered 100% in options against the 75/25 option-and-RSU mix used for the other named executives [95]. Charter set that package in the same year the stock fell to $208.75 from a September 2021 high of $821.01 [96]. Winfrey and DiGeronimo may use company aircraft for up to 125 and 50 hours of discretionary personal use per year [97]; the incremental cost of that use in 2025 was $350,763 and $227,303 respectively [98].
Also approved in December 2025: one-time equity grants contingent on the Cox closing, each worth 1.5 times the executive's annual long-term incentive target and delivered 50% in time-vested options and 50% in time-vested RSUs, with no performance condition [99] [100].
The plan-level guardrails, as disclosed:
- No repricing of options without shareholder approval, an amendment the board adopted on January 28, 2020; no repricing occurred under the 2009 Plan [101].
- Clawback under a policy effective October 1, 2023 complying with NASDAQ Rule 5608, covering the three fiscal years before a required restatement [102].
- Hedging and short sales prohibited for restricted employees, a group that includes all vice presidents and above and all board members [103].
- Ownership guidelines of 5x salary for the CEO, 2x for executive vice presidents and 3x the cash retainer for outside directors — with no deadline for compliance, and expressly not applicable to officers, directors or affiliates of any stockholder holding 10% or more [104]. That carve-out covers the five designees of Liberty Broadband and A/N.
- Say-on-pay every three years, a frequency chosen in 2023 with approximately 51% of votes cast [105].
- Independent consultant Semler Brossy, which the committee states provided no other services to Charter in 2025 [106].
What the Pay Actually Paid
Source: 2026 Proxy Statement, Tabular Disclosure of Pay Versus Performance; 2022 shows Rutledge's figures, the year Winfrey became CEO on December 1 [107].
Source: 2026 Proxy Statement, Pay Versus Performance total shareholder return columns [108].
Compensation Actually Paid tracked the share price in both directions. Winfrey's 2023 Summary Compensation Table total of $89,077,078 is the year the five-year program was booked at grant-date fair value [109]. His 2025 table total was $6,466,193 and his Compensation Actually Paid was negative $46,096,708 — a ratio of minus 7.1 times, against a $100 investment in Charter worth $32 and the peer group worth $127 [110] [111]. Because the 2023 program front-loaded five years of equity, Winfrey received no new stock or option award in 2024 or 2025 [112].
That mechanic also produces a low CEO-to-median pay ratio for a company of this size: 81.7 to 1 for 2025, on a median employee total of $79,159 across roughly 92,000 US employees [113].
Cash did move. Winfrey realized $5,864,083 exercising 34,046 options in 2025, and DiGeronimo $1,196,229 on 9,050 [114]. Those were 2015-vintage options; the post-2016 grants remain underwater.
Severance, on a hypothetical December 31, 2025 termination without cause: $29,520,833 for Winfrey (of which $25,000,000 is cash severance), $13,386,401 for DiGeronimo and $6,993,342 for Fischer, with the stock option column at zero for every executive because every unvested option was out of the money [115]. On a for-cause or voluntary departure, no severance is payable and all unvested equity is cancelled [116].
The 2026 shareholder vote
At the April 21, 2026 annual meeting, the advisory vote on executive compensation drew 98,047,867 votes for and 30,289,182 against — 76.4% support — the first say-on-pay ballot since 2023 under the triennial schedule. The amendment adding 16.0 million shares to the 2019 Stock Incentive Plan passed with 90,820,528 for and 37,522,506 against, or 70.8% [117]. Both tallies include the Liberty Broadband and A/N blocs, which together hold roughly 42% of the voting stock. Balan Nair drew the largest opposition among directors, with 9,597,998 votes against [118].
A shareholder proposal from the New York State Common Retirement Fund seeking disclosure of political expenditure recipients failed for the third consecutive year, drawing 23,286,541 for against 104,891,888 opposed in 2026 [119]. Charter's own disclosure records 18.72% of votes cast in favor in 2025 and 22.01% in 2024, and the proponent notes that 25.5% of Charter's unaffiliated shareholders supported the 2025 version [120]. The gap between the two figures is the designating blocs.
Insider Activity
Source: Charter Form 4 filings — the Rutledge open-market sales and the 2026 purchases by Davis, Winfrey, Nair and Ramos [121], the Merritt sale and the July 2025 purchases by Winfrey and Nair [122], and DiGeronimo's 10b5-1 sale [123]. Winfrey's April 2026 purchase combines 3,468 shares held directly and 3,468 held by spouse from a single Form 4; Rutledge's May 27 row combines two sales of 9,100 shares at $146.96 and $146.92.
Two patterns sit in that table. Serving insiders bought on the way down: roughly $4.9 million of open-market purchases across six transactions, at prices from $274.21 in July 2025 to $140.93 in May 2026, with Winfrey buying twice — once at $273.10 and again at $172.23 [124] [125]. The largest sale came from outside the serving group: Thomas Rutledge, Director Emeritus and CEO until 2022, sold 87,833 shares across May 26 and 27, 2026 for approximately $12.7 million [126].
Winfrey also exercised 24,064 options struck at $183.87 on January 15, 2026 — the day they expired — with 23,366 shares withheld for taxes at $194.61, and received a grant of 80,047 new options the same day [127]. All applicable Section 16(a) filings for fiscal 2025 were made on time [128].
Related-Party Ledger
Charter's Related Party Transactions Policy captures arrangements above $120,000 involving officers, directors, 5% holders and their immediate families, reviewed by the Audit Committee. Open-market and privately negotiated transactions in Charter securities are expressly excluded from the definition [129].
Sources: 2026 Proxy Statement, Certain Relationships and Related Transactions — the A/N tax distributions and tax receivables agreement [130] and the QVC Group carriage and revenue-sharing relationship [131]; Q2 FY2026 Form 10-Q liquidity disclosure [132].
The Liberty Broadband arrangement carries the most moving parts. Under the November 2024 amendment, Charter repurchases stock from Liberty Broadband every month in an amount equal to the greater of $100 million and Liberty Broadband's minimum liquidity threshold. If a repurchase would drop Liberty Broadband's equity interest below 25.25%, or is not permitted by law, Charter must instead lend it the money. Liberty Broadband applies the proceeds to repay its own debt, and it is exempted from the standstill and ownership cap to the extent the repurchases push it above them [133]. That lending clause became operative: in May 2026 Charter advanced a term loan of approximately $359 million to Liberty Broadband [134]. Charter also agreed on March 5, 2026 to an administrative amendment adjusting the monthly liquidity calculation and accelerating that month's buyback process [135].
A/N moved the other way. On August 4, 2025 it notified Charter that it was suspending the standing repurchase agreement, intending the suspension to run through the closing or termination of the Cox Transactions while reserving the right to end it sooner [136]. Charter Holdings bought no units from A/N in the first half of 2026 [137]. One shareholder is selling into the buyback under contract while the other has stepped out of it — which is the mechanical reason A/N's stake rose from 12.40% to 13.12% over 2025 [138] [139].
Officer and Director Docket
No litigation, regulatory proceeding, investigation, sanction or disclosed settlement naming a current Charter officer or director appears in the FY2025 Form 10-K or the 2026 proxy statement. The legal proceedings note discloses corporate matters only: an investigation by the California Attorney General and the Alameda County District Attorney into whether certain waste disposal policies violate the California Business and Professions Code and Health and Safety Code, commenced in January 2014, with a similar Time Warner Cable investigation begun in February 2012 and Charter stating it is cooperating; intellectual property infringement suits; and ordinary-course claims and regulatory inquiries [140]. Charter's certificate of incorporation limits director and officer liability to the maximum permitted by Delaware law, and Charter has entered indemnification agreements with each director and executive officer [141].
The Compensation and Benefits Committee reports no interlocks: no committee member was a Charter officer or employee, and no Charter executive officer served on the compensation committee of another company whose executive sits on Charter's board or its compensation committee [142].
What Changes and When
Sources: stockholders agreement and amendments [143] [144]; special meeting result [145]; A/N suspension [146]; Winfrey agreement [147]; Davis appointment [148]; term loan [149]; Jeffery appointment [150]; program forfeiture date [151]. The term loan date is shown as month-start; the filing states May 2026 without a day.
Both closings are contingent, and the governance consequences run in opposite directions. Liberty Broadband's exit removes three board designees and one privileged shareholder. Cox Enterprises' arrival adds a shareholder with a higher acquisition cap (30%) than either incumbent holds today, three board designees, and — for three years — the chair. How the operating model those directors oversee actually makes money is covered in Business; the multi-year record of what management said and then did sits in History.
The numbers behind Charter Communications, Inc.: as-reported financial statements and company metrics for FY2021–FY2025, traced to the source filings, opened with the share-price history those statements have to justify. Every linked figure opens the exact page of the filing it was printed on, with the statement row highlighted. Amounts in US$ millions unless noted.
Reading notes: All figures are in US$ millions as printed in the filings (dollars in millions, except per-share and share data), except per-share rows, share counts and customer-count KPIs. FY2021–FY2025 income statement, balance sheet and cash flow figures are each taken from that fiscal year's own Form 10-K; every cell in those four core statements is cited. Revenue by product line: Charter moved mobile service revenue into residential revenue and renamed 'Small and medium business' / 'Enterprise' to 'Small business' / 'Mid-market and large business'. Row labels use the current (FY2025 Form 10-K) names; FY2021–FY2022 values are the restated comparatives printed in the FY2023 Form 10-K, whose row labels still read 'Small and medium business' and 'Enterprise'. The 'Connectivity' subtotal was first presented in the FY2025 Form 10-K and is therefore blank for FY2021–FY2022. Later filings apply small reclassifications within the revenue split (for example FY2023 video revenue is 16,351 in the FY2023 Form 10-K and 16,353 in the FY2025 Form 10-K); totals are unaffected. FY2023–FY2025 are shown on the FY2025 Form 10-K basis.
Share Price — Full Available History — 17 Years
The stock closed at $144.98 on Jul 31, 2026 — up 314% over the window shown (+9.0% a year), trading between $29.50 and $821.01. At that close the stock trades at 4.0× FY2025 diluted EPS as reported below.
Source: market price feed, monthly closes, sampled from 4,169 source observations, Jan 2010–Jul 2026. Price return only, excludes dividends.
Market capitalization $20.0bn and enterprise value $114.2bn.
Market cap = 137.7M shares outstanding × the Jul 31, 2026 close of $144.98. Enterprise value adds total debt of $94.8bn and subtracts cash and equivalents of $477mn (net debt of $94.3bn), from the FY2025 balance sheet. Market-derived figures, shown without filing links.
FY2025 at a Glance
Revenue (US$ millions)
Net income (US$ millions)
Diluted EPS
Source: FY2025 consolidated statements [1] [2] [3] [4]. Click any linked figure to open the filing page with the row highlighted.
Revenue by Product Line
| Revenue by Product Line | FY2021 | FY2022 | FY2023 | FY2024 | FY2025 |
|---|---|---|---|---|---|
| Internet | 21,094 | 22,222 | 23,032 | 23,360 | 23,765 |
| Mobile service | 1,239 | 1,698 | 2,243 | 3,083 | 3,762 |
| Connectivity | — | — | 25,275 | 26,443 | 27,527 |
| Video | 17,630 | 17,460 | 16,353 | 15,129 | 13,703 |
| Voice | 1,598 | 1,559 | 1,510 | 1,437 | 1,350 |
| Residential revenue | 41,561 | 42,939 | 43,138 | 43,009 | 42,580 |
| Small business | 4,198 | 4,350 | 4,355 | 4,376 | 4,346 |
| Mid-market and large business | 2,573 | 2,677 | 2,767 | 2,878 | 2,969 |
| Commercial revenue | 6,771 | 7,027 | 7,122 | 7,254 | 7,315 |
| Advertising sales | 1,594 | 1,882 | 1,551 | 1,780 | 1,468 |
| Other | 1,756 | 2,174 | 2,796 | 3,042 | 3,411 |
| Total revenues | 51,682 | 54,022 | 54,607 | 55,085 | 54,774 |
| Total revenues growth, derived | — | +4.5% | +1.1% | +0.9% | -0.6% |
Source: Form 10-K revenue note (revenues by product line). FY2023–FY2025 as presented in the FY2025 Form 10-K; FY2021–FY2022 as presented in the FY2023 Form 10-K, the earliest filing in the corpus using the current residential cut. [5] [6]. Click any linked figure to open the filing page with the row highlighted.
Income Statement
Source: Consolidated Statements of Operations, each fiscal year's own Form 10-K [1] [2] [3] [4]. Click any linked figure to open the filing page with the row highlighted.
Columns marked E are consensus analyst estimates from S&P Capital IQ (CapIQ), shown alongside reported results for direct comparison; they are not company guidance.
Estimate source: S&P Capital IQ (CapIQ) consensus, as of 2026-08-03. Estimate figures are S&P Capital IQ consensus (vendor data — no filing page links). EPS and net income use the normalized (adjusted) consensus where the street reports it. Line-item analyst models (segments, drivers, KPIs) are in the Visible Alpha tab.
Balance Sheet
Source: Consolidated Balance Sheets, each fiscal year's own Form 10-K [7] [8] [9] [10]. Click any linked figure to open the filing page with the row highlighted.
Cash Flow
Source: Consolidated Statements of Cash Flows, each fiscal year's own Form 10-K [11] [12] [13] [14]. Click any linked figure to open the filing page with the row highlighted.
Operating Costs and Expenses by Category
| Operating Costs and Expenses by Category | FY2021 | FY2022 | FY2023 | FY2024 | FY2025 |
|---|---|---|---|---|---|
| Programming | — | — | 10,638 | 9,653 | 8,822 |
| Other costs of revenue | — | — | 5,587 | 6,351 | 6,704 |
| Field and technology operations | — | — | 5,236 | 5,183 | 5,165 |
| Customer operations | — | — | 3,239 | 3,162 | 3,115 |
| Marketing and residential sales | — | — | 3,469 | 3,590 | 3,782 |
| Stock compensation expense | — | — | 692 | 651 | 673 |
| Transition expenses | — | — | — | — | 19 |
| Other expense | — | — | 4,544 | 4,577 | 4,459 |
| Total operating costs and expenses | — | — | 33,405 | 33,167 | 32,739 |
Source: FY2025 Form 10-K, Note 15 Segment Reporting. Charter redefined these cost categories in the FY2024 Form 10-K, so FY2021–FY2022 are not available on a comparable basis and are left blank. [15]. Click any linked figure to open the filing page with the row highlighted.
Long-Term Record
| Fiscal year | Revenues | Income from operations | Net income attributable to Charter shareholders | Diluted earnings per common share | Net cash flows from operating activities | Purchases of property, plant and equipment | Total Charter shareholders' equity |
|---|---|---|---|---|---|---|---|
| FY2016 | 29,003 | 2,456 | 3,522 | 15.94 | 8,041 | (5,325) | 40,139 |
| FY2017 | 41,581 | 4,106 | 9,895 | 34.09 | 11,954 | (8,681) | 39,084 |
| FY2018 | 43,634 | 5,221 | 1,230 | 5.22 | 11,767 | (9,125) | 36,285 |
| FY2019 | 45,764 | 6,511 | 1,668 | 7.45 | 11,748 | (7,195) | 31,445 |
| FY2020 | 48,097 | 8,405 | 3,222 | 15.40 | 14,562 | (7,415) | 23,805 |
| FY2021 | 51,682 | 10,526 | 4,654 | 24.47 | 16,239 | (7,635) | 14,050 |
| FY2022 | 54,022 | 11,962 | 5,055 | 30.74 | 14,925 | (9,376) | 9,119 |
| FY2023 | 54,607 | 12,559 | 4,557 | 29.99 | 14,433 | (11,115) | 11,086 |
| FY2024 | 55,085 | 13,118 | 5,083 | 34.97 | 14,430 | (11,269) | 15,587 |
| FY2025 | 54,774 | 12,908 | 4,987 | 36.21 | 16,077 | (11,659) | 16,054 |
Source: consolidated statements across filings; older years from the standardized feed [11] [1] [7] [12]. Click any linked figure to open the filing page with the row highlighted.
Operating KPIs
| KPI | FY2021 | FY2022 | FY2023 | FY2024 | FY2025 |
|---|---|---|---|---|---|
| Total customer relationships | 32,069,000 | 32,195,000 | 32,126,000 | 32,214,000 | 31,846,000 |
| Total Internet customers | 30,089,000 | 30,433,000 | 30,588,000 | 30,083,000 | 29,680,000 |
| Total mobile lines | 3,564,000 | 5,292,000 | 7,766,000 | 9,858,000 | 11,766,000 |
| Total video customers | 15,833,000 | 15,147,000 | 14,122,000 | 12,892,000 | 12,605,000 |
| Total voice customers | 9,903,000 | 8,983,000 | 8,005,000 | 6,884,000 | 6,046,000 |
Source: company-reported operating metrics [16] [17] [18] [19]. Click any linked figure to open the filing page with the row highlighted.
Analyst Consensus
Mean target
Median target
High target
Low target
Street ratings: 5 strong buy, 11 hold, 2 sell, 3 strong sell. Consensus: Hold.
Estimate source: S&P Capital IQ (CapIQ) consensus, as of 2026-08-03. Estimate figures are S&P Capital IQ consensus (vendor data — no filing page links). EPS and net income use the normalized (adjusted) consensus where the street reports it. Line-item analyst models (segments, drivers, KPIs) are in the Visible Alpha tab.
Traceability
481 of 503 figures on this page (96%) link to the filing page where they are printed — click a linked figure to open the source PDF at that page with the row highlighted. Unlinked figures come from standardized data feeds or pre-filing years.
All figures are in US$ millions as printed in the filings (dollars in millions, except per-share and share data), except per-share rows, share counts and customer-count KPIs.
FY2021–FY2025 income statement, balance sheet and cash flow figures are each taken from that fiscal year's own Form 10-K; every cell in those four core statements is cited.
Revenue by product line: Charter moved mobile service revenue into residential revenue and renamed 'Small and medium business' / 'Enterprise' to 'Small business' / 'Mid-market and large business'. Row labels use the current (FY2025 Form 10-K) names; FY2021–FY2022 values are the restated comparatives printed in the FY2023 Form 10-K, whose row labels still read 'Small and medium business' and 'Enterprise'. The 'Connectivity' subtotal was first presented in the FY2025 Form 10-K and is therefore blank for FY2021–FY2022.
Later filings apply small reclassifications within the revenue split (for example FY2023 video revenue is 16,351 in the FY2023 Form 10-K and 16,353 in the FY2025 Form 10-K); totals are unaffected. FY2023–FY2025 are shown on the FY2025 Form 10-K basis.
FY2016–FY2018 long-term-record figures come from the standardized SEC XBRL data feed and carry no page links. FY2019–FY2020 are cited to the comparative columns of the FY2021 Form 10-K.
Operating cost categories were redefined in the FY2024 Form 10-K (and again refined in FY2025), so the operating-cost table covers FY2023–FY2025 only, all on the FY2025 Form 10-K basis.
Customer KPIs: Charter replaced its 'small and medium business' customer definition with 'small business' in 2025, restating FY2024. FY2024 and FY2025 are shown on the restated basis (FY2025 Form 10-K); FY2021–FY2023 are as originally reported in their own Forms 10-K, so there is a definitional break between FY2023 and FY2024.
The numeric feed (data/financials/income.json, balance_sheet.json, cash_flow.json) agrees with the filings for every FY2016–FY2025 line used here; the only feed-versus-filing differences are the revenue-split reclassifications listed in discrepancies.
5 figure(s) differed between the data feed and the filing; the filing value is shown (see the run's metrics/metrics_tab.json for the audit trail).
Charter Communications, Inc.'s management explains the business in its own materials. The slides below do the most of that work, pulled from the documents preserved in Sources. Each source link opens the complete presentation at that slide in a new tab.
Second Quarter 2026 Results — 2Q 2026
Charter's most recent results deck: current scale, segment revenue, the capex step-down and the free cash flow case that rests on it. · Open the full document →
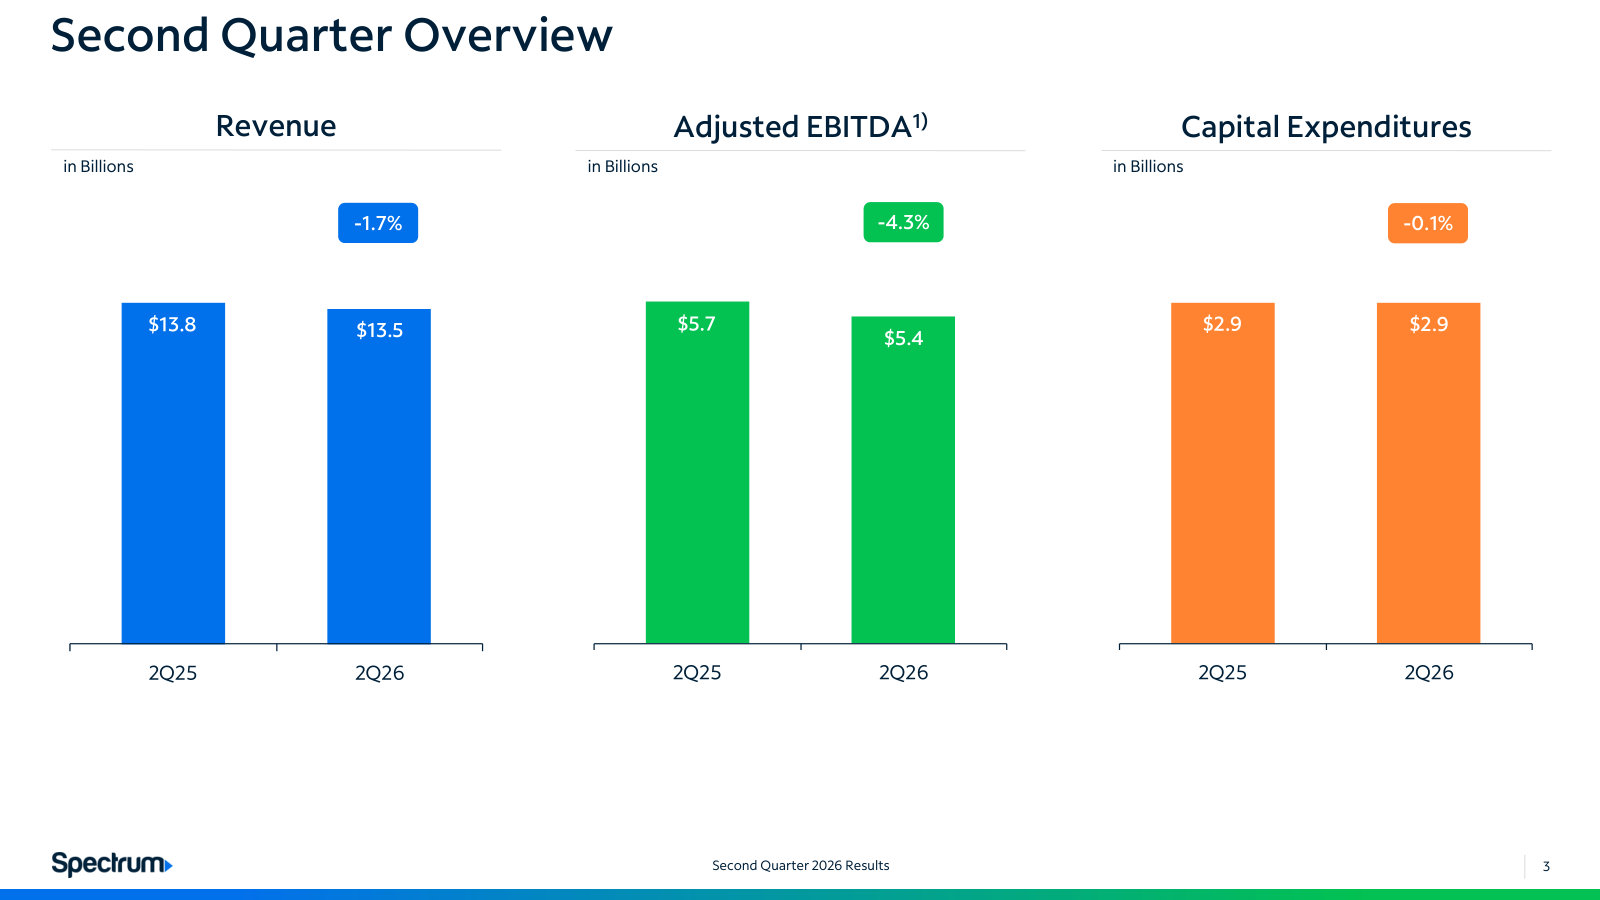
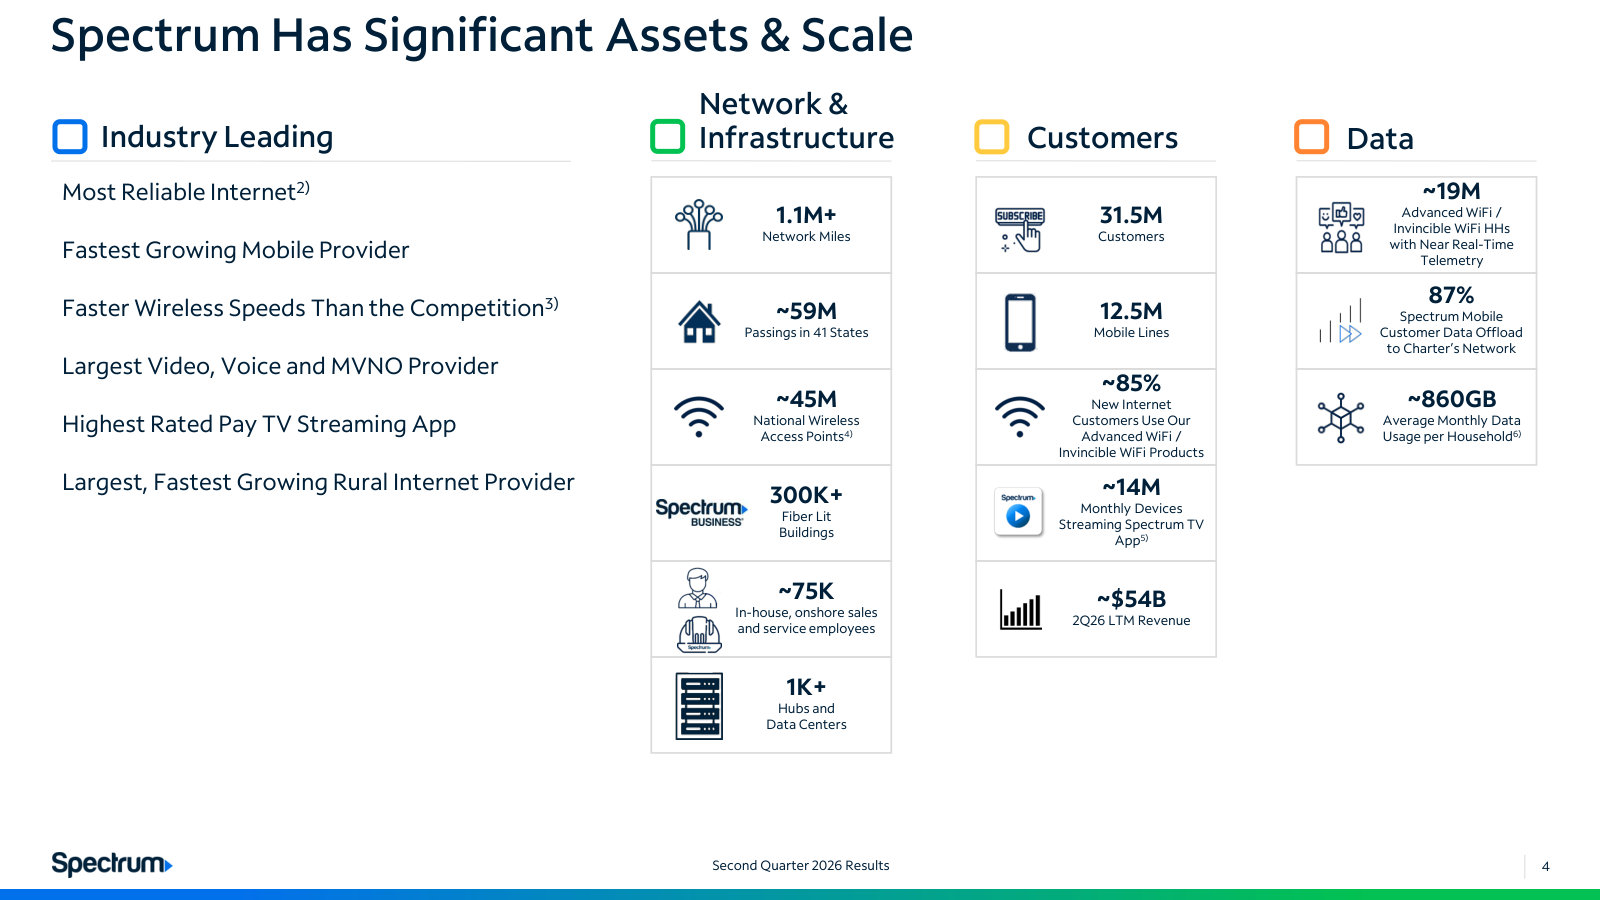
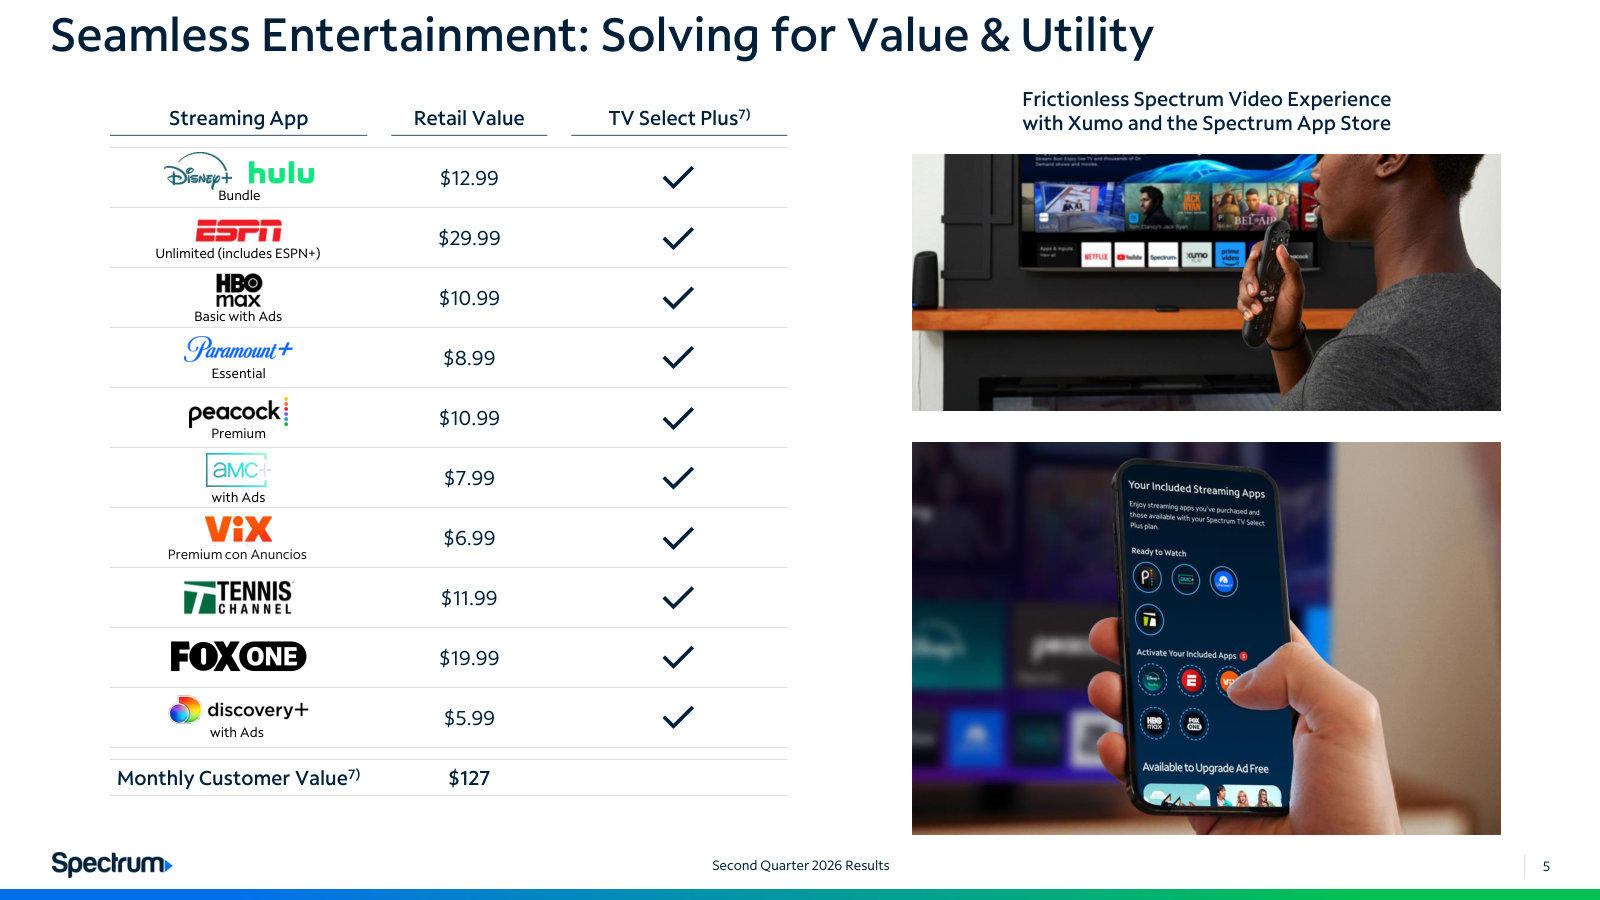
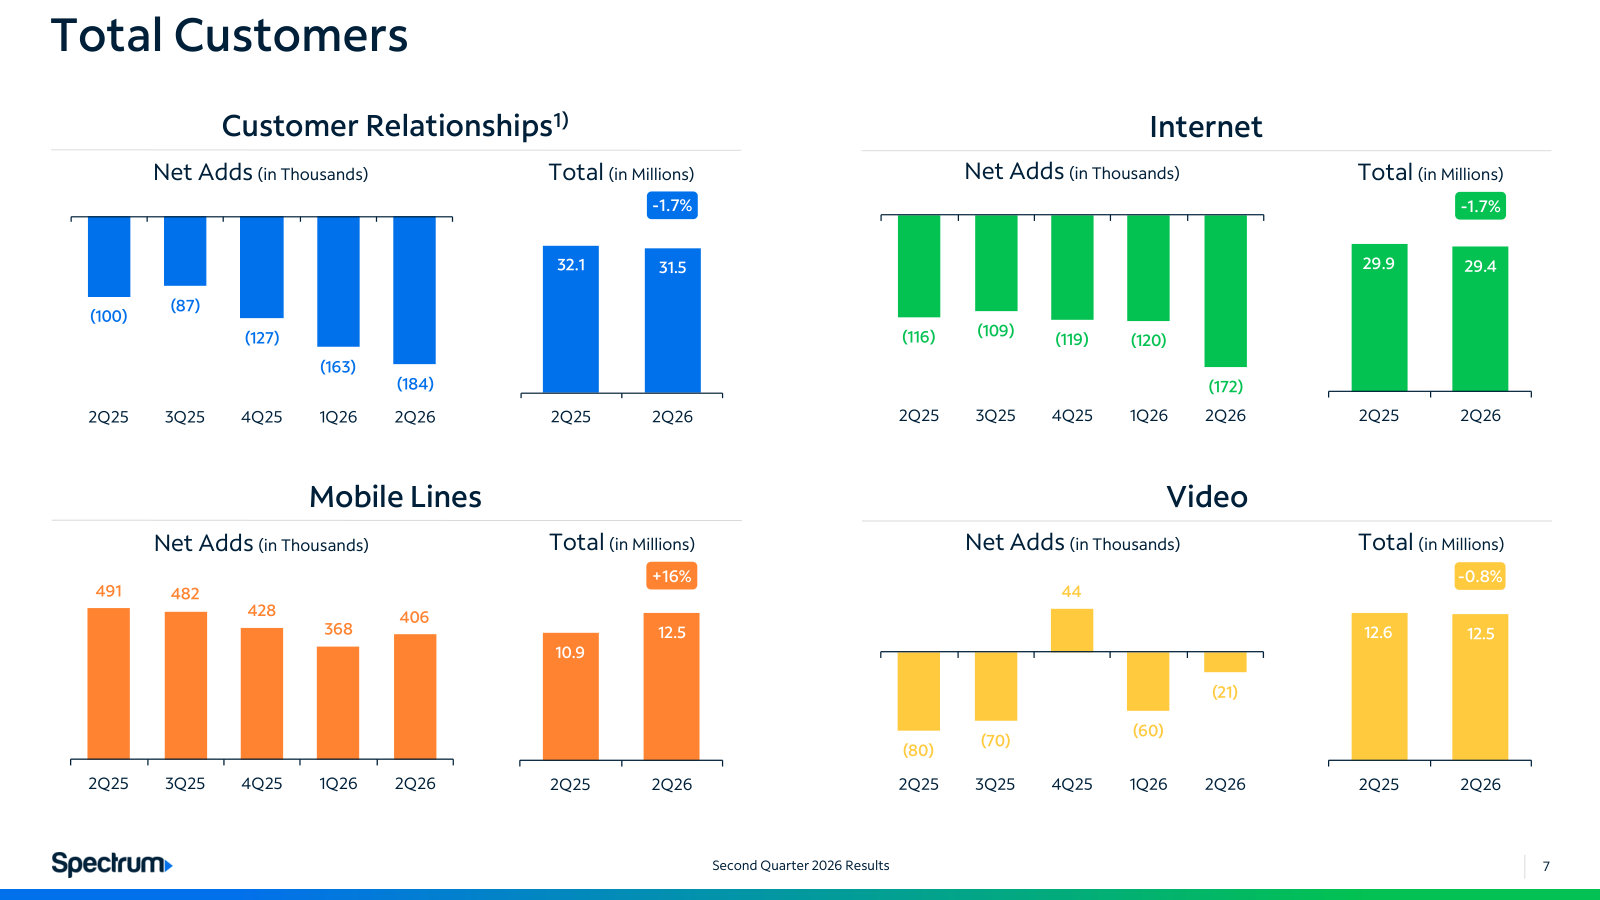
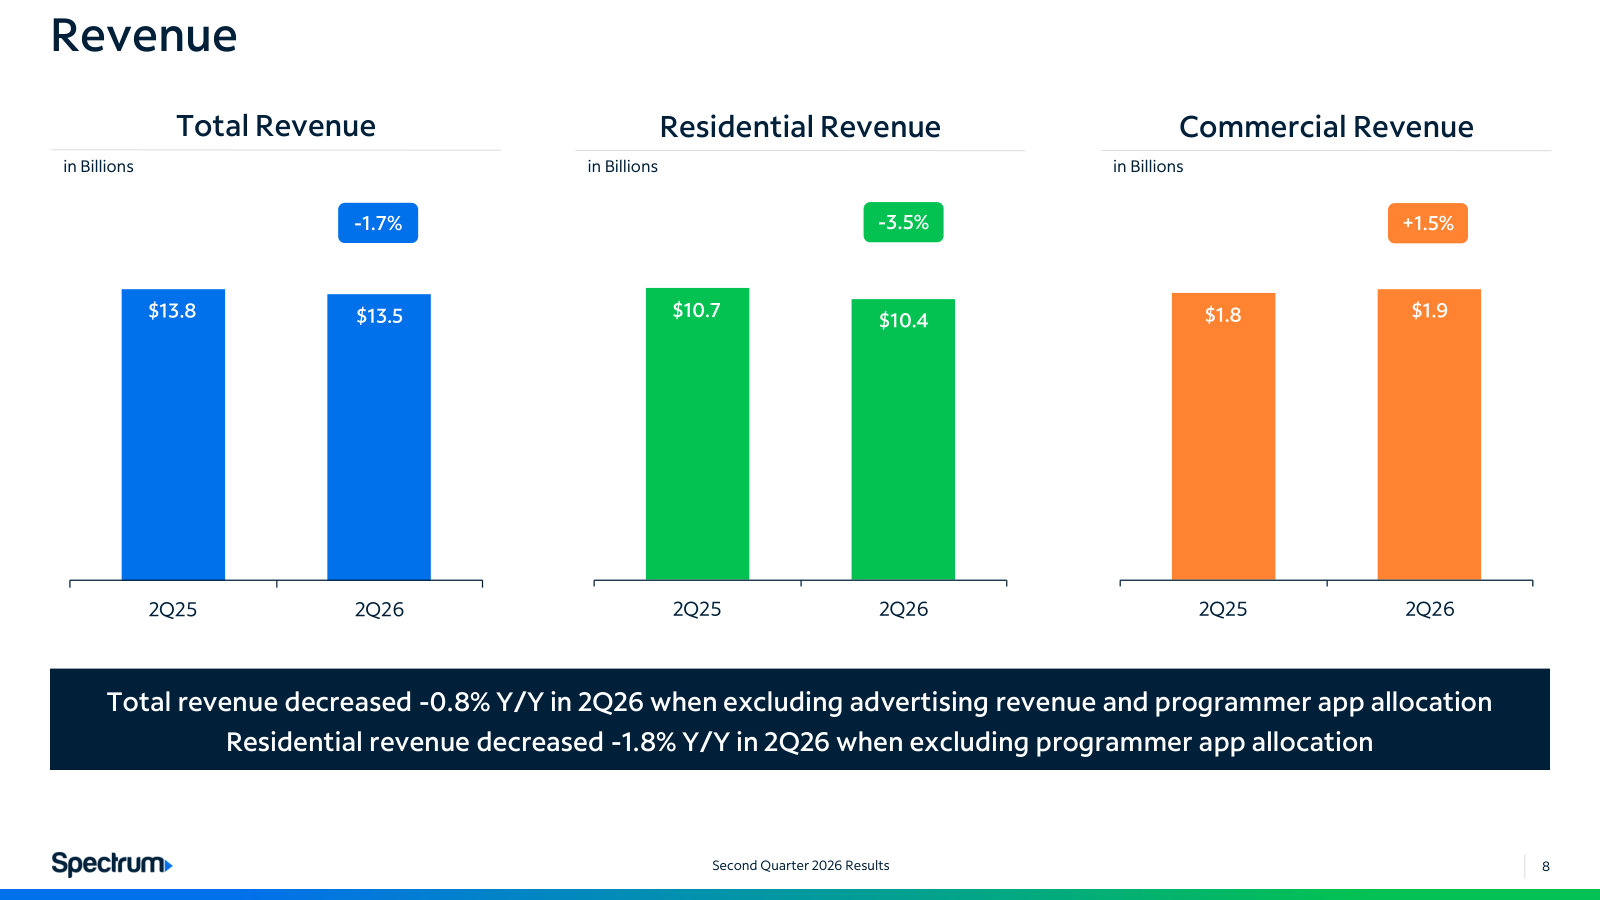
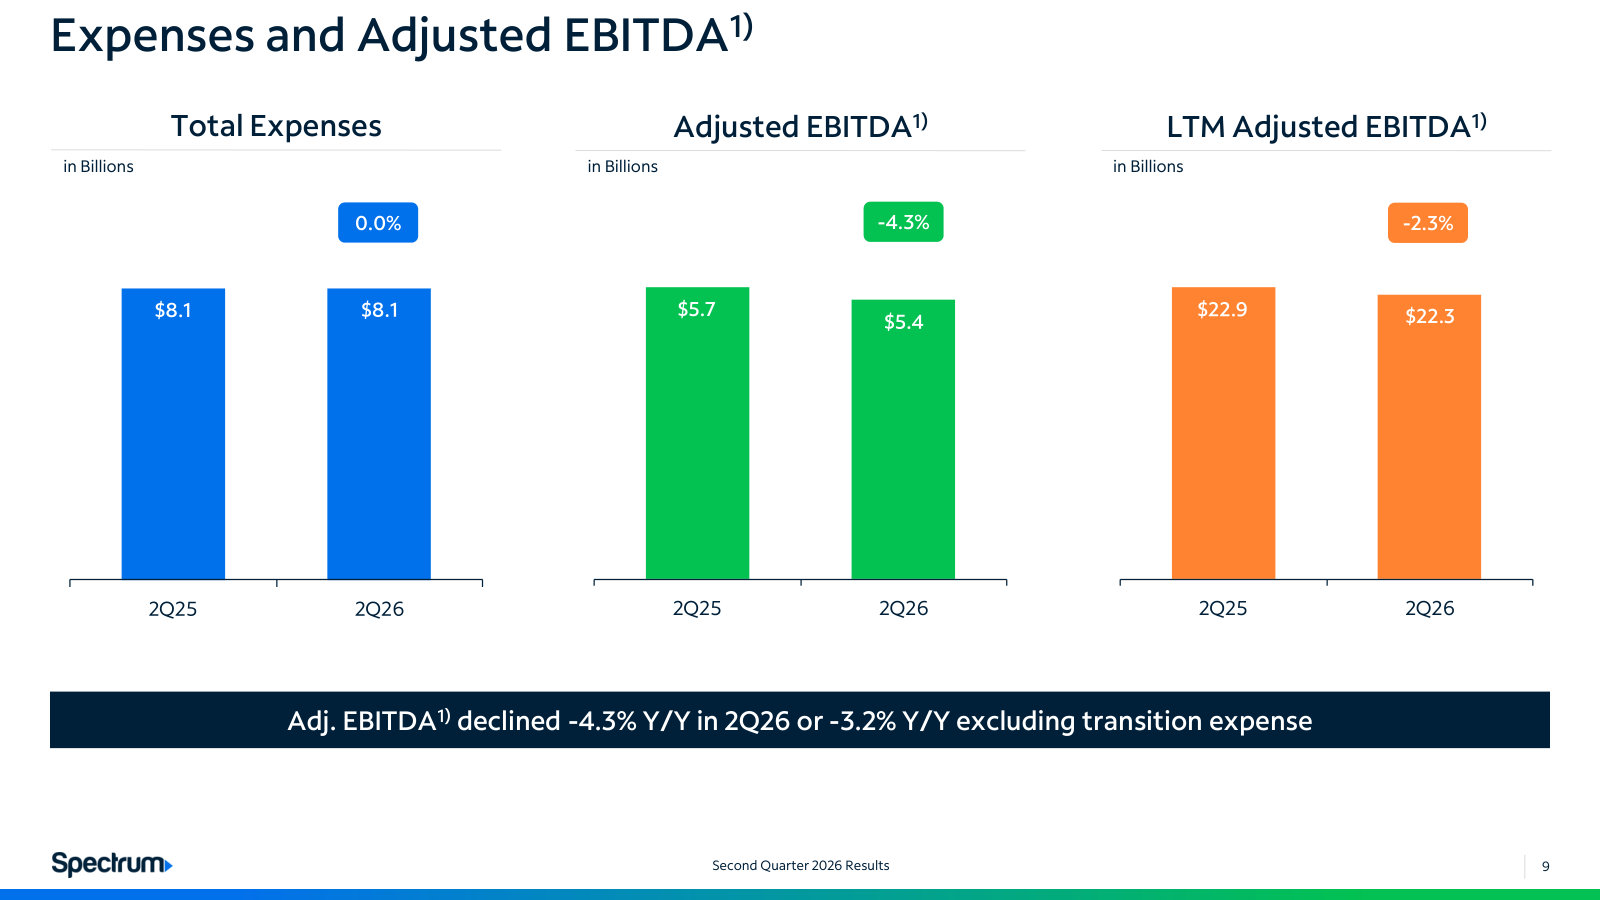
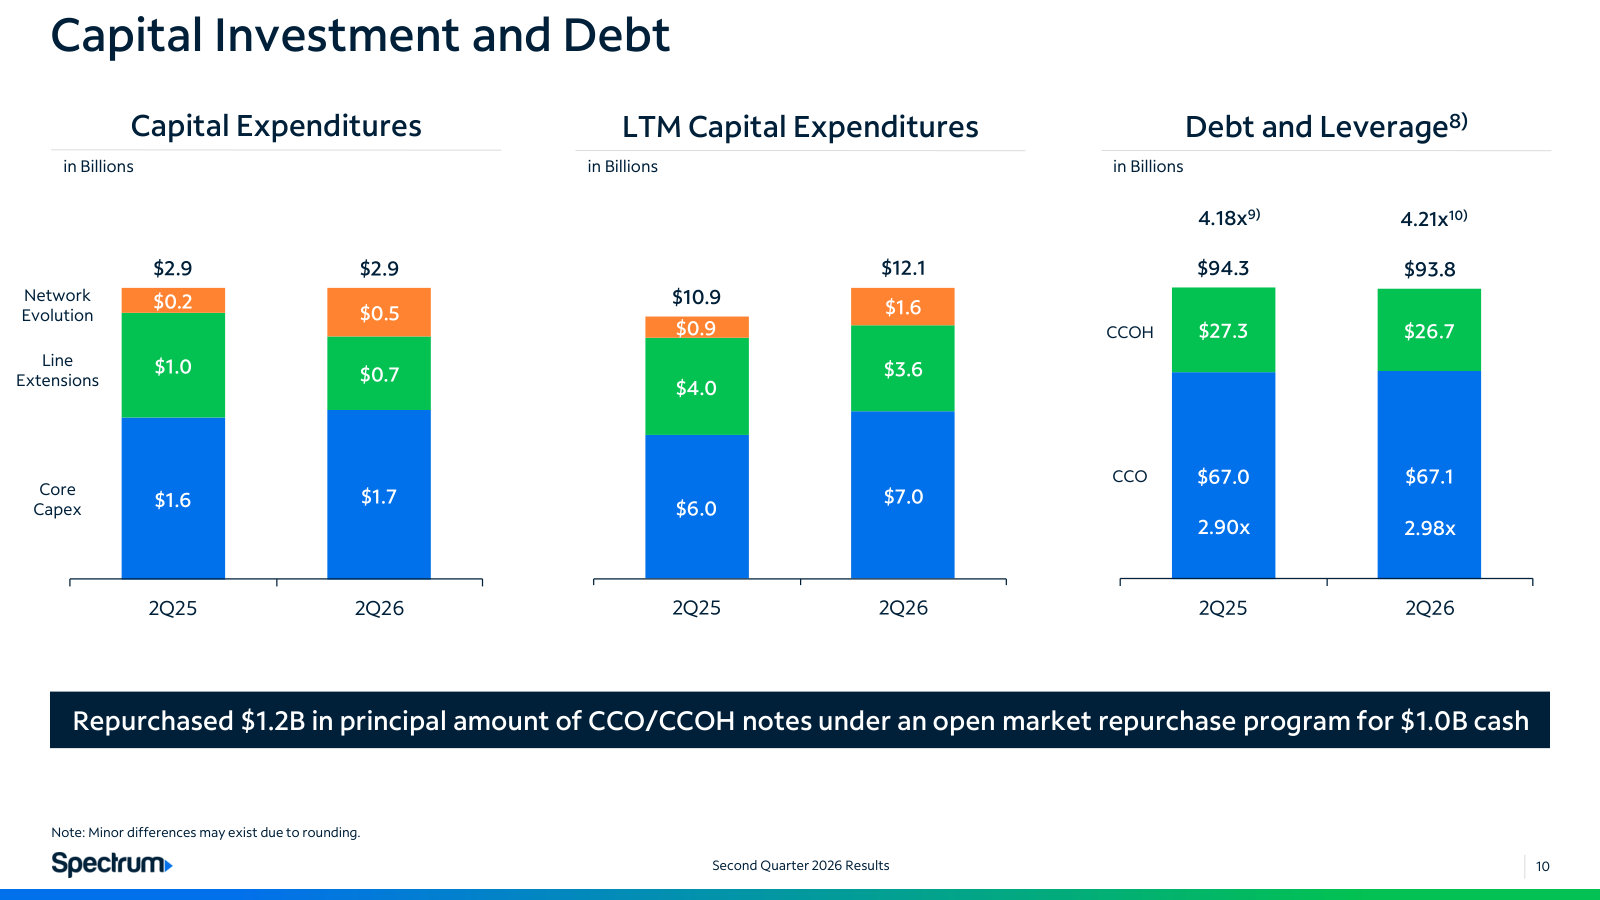
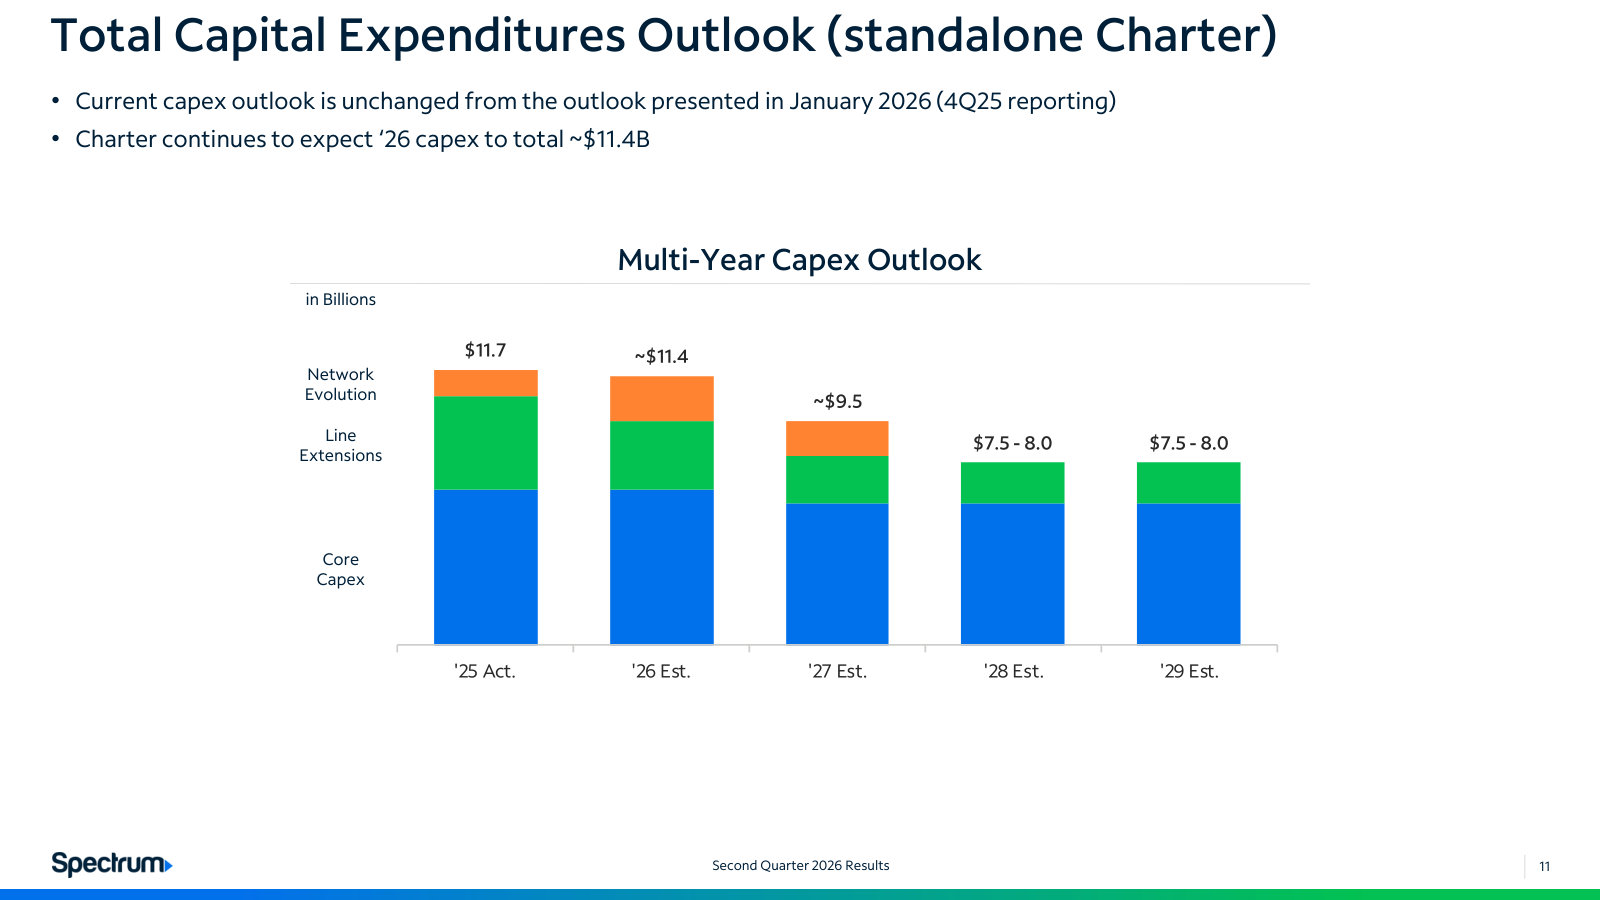
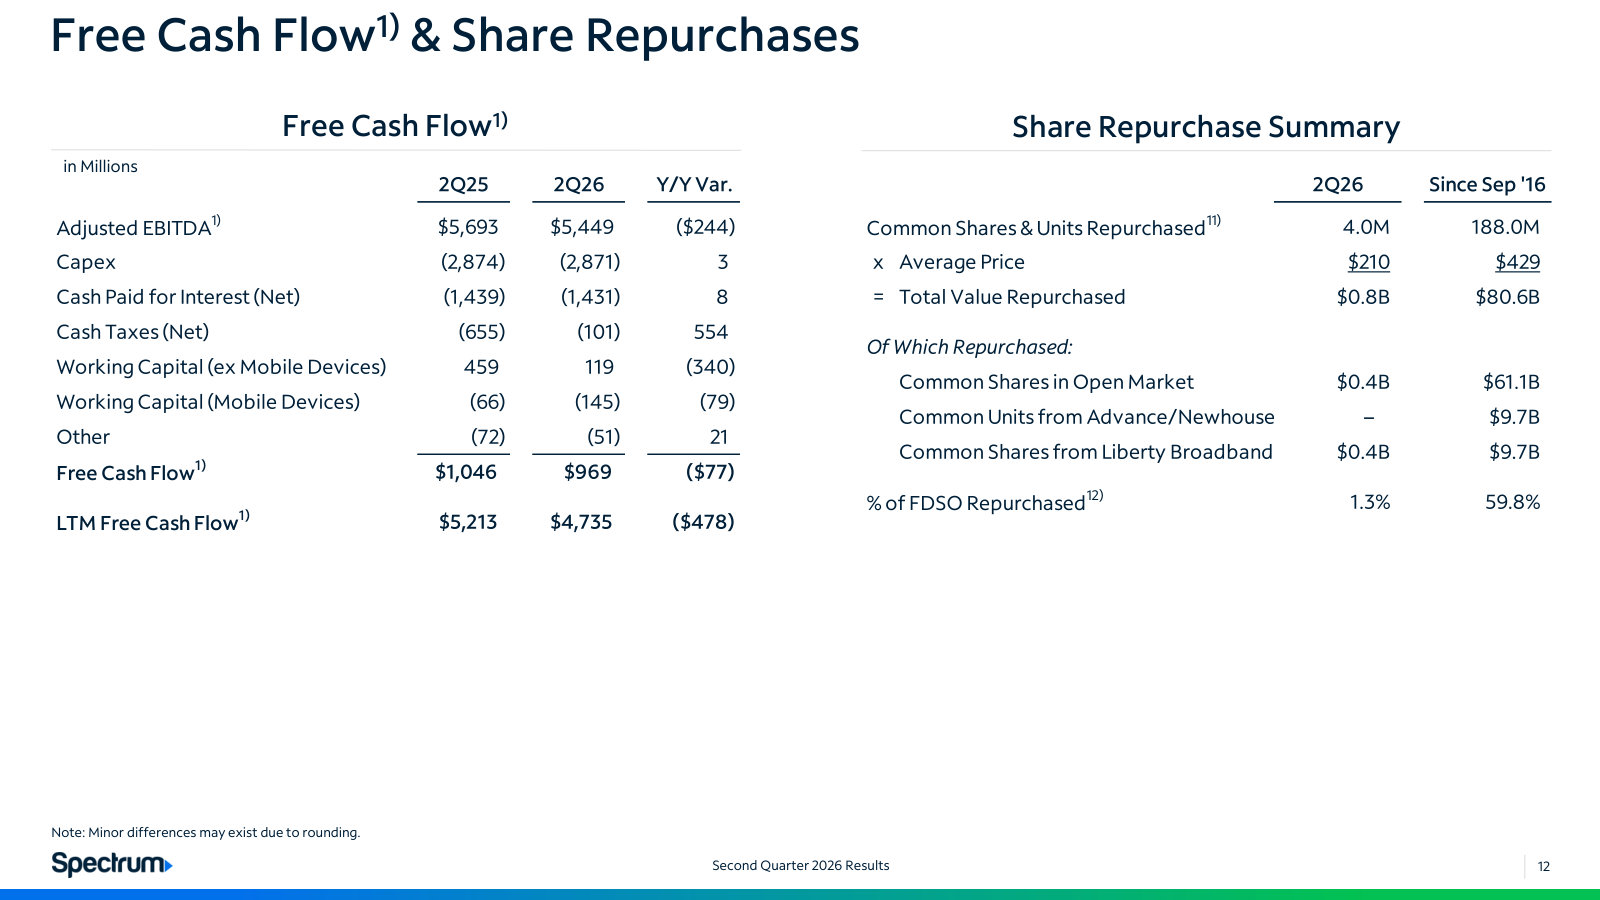
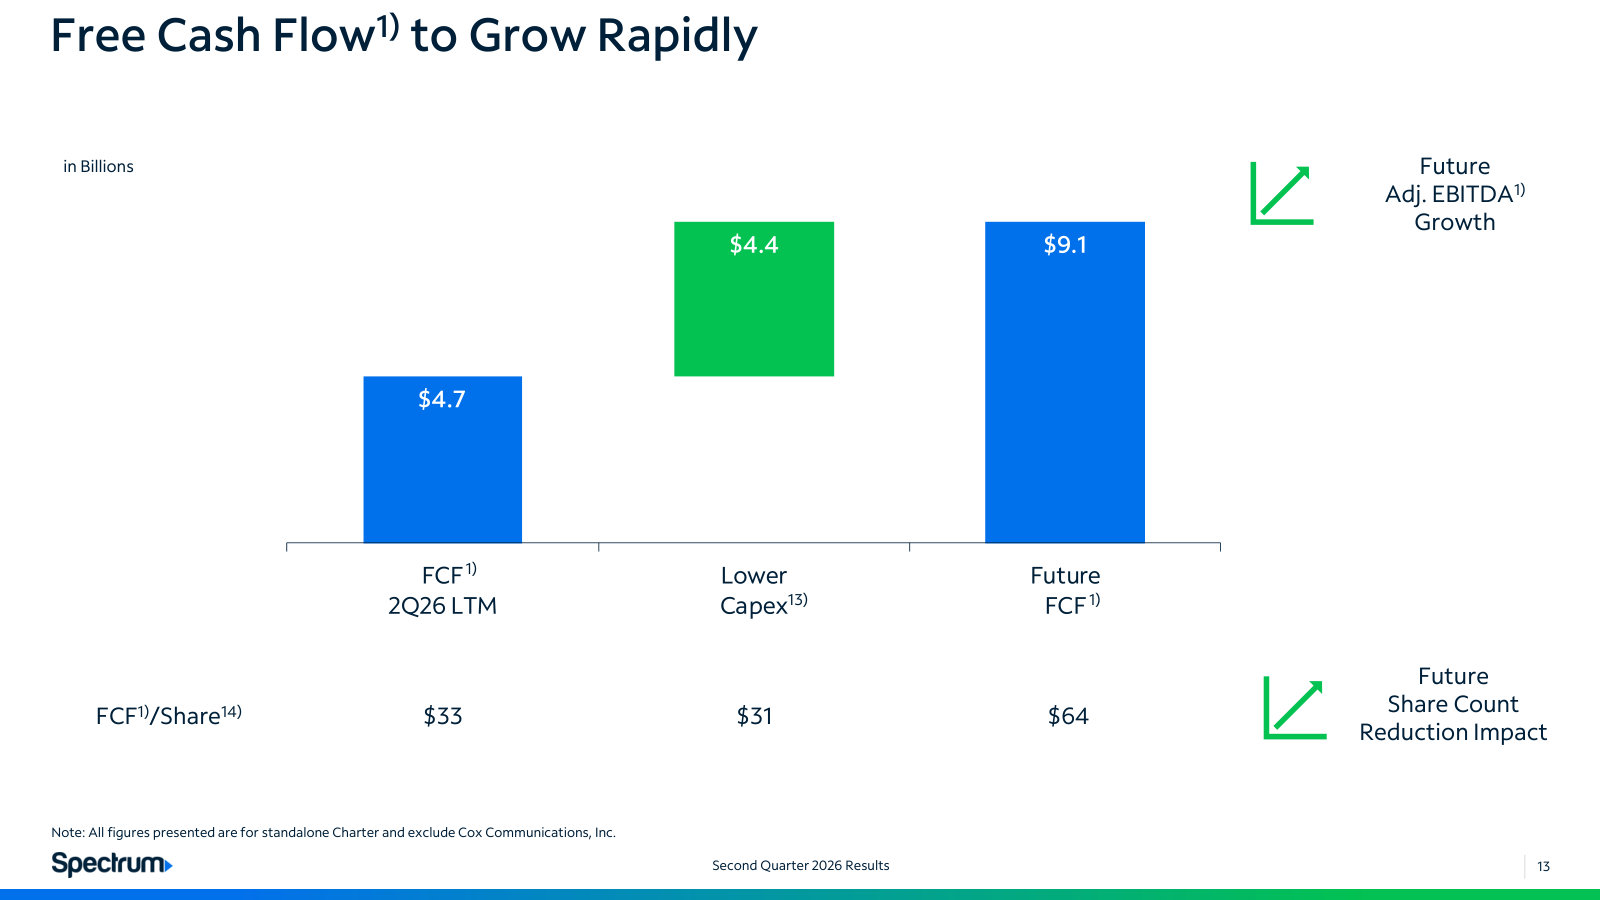
Fourth Quarter and Full Year 2025 Results — FY 2025
The full-year 2025 scorecard, plus the pricing comparison and service guarantees management uses to explain the value proposition. · Open the full document →
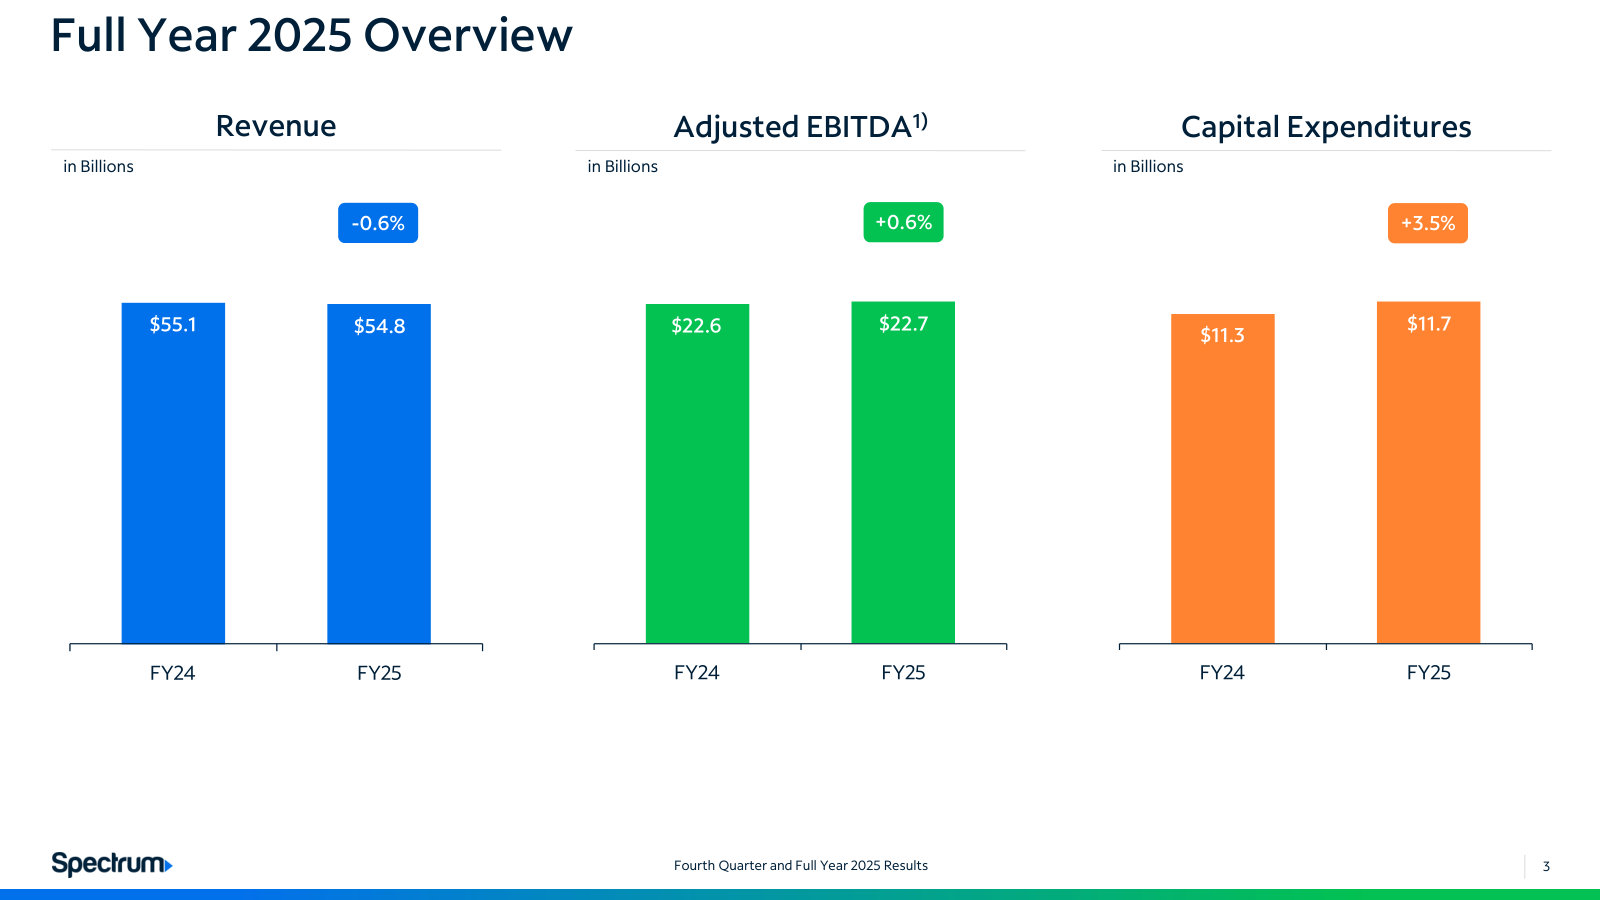
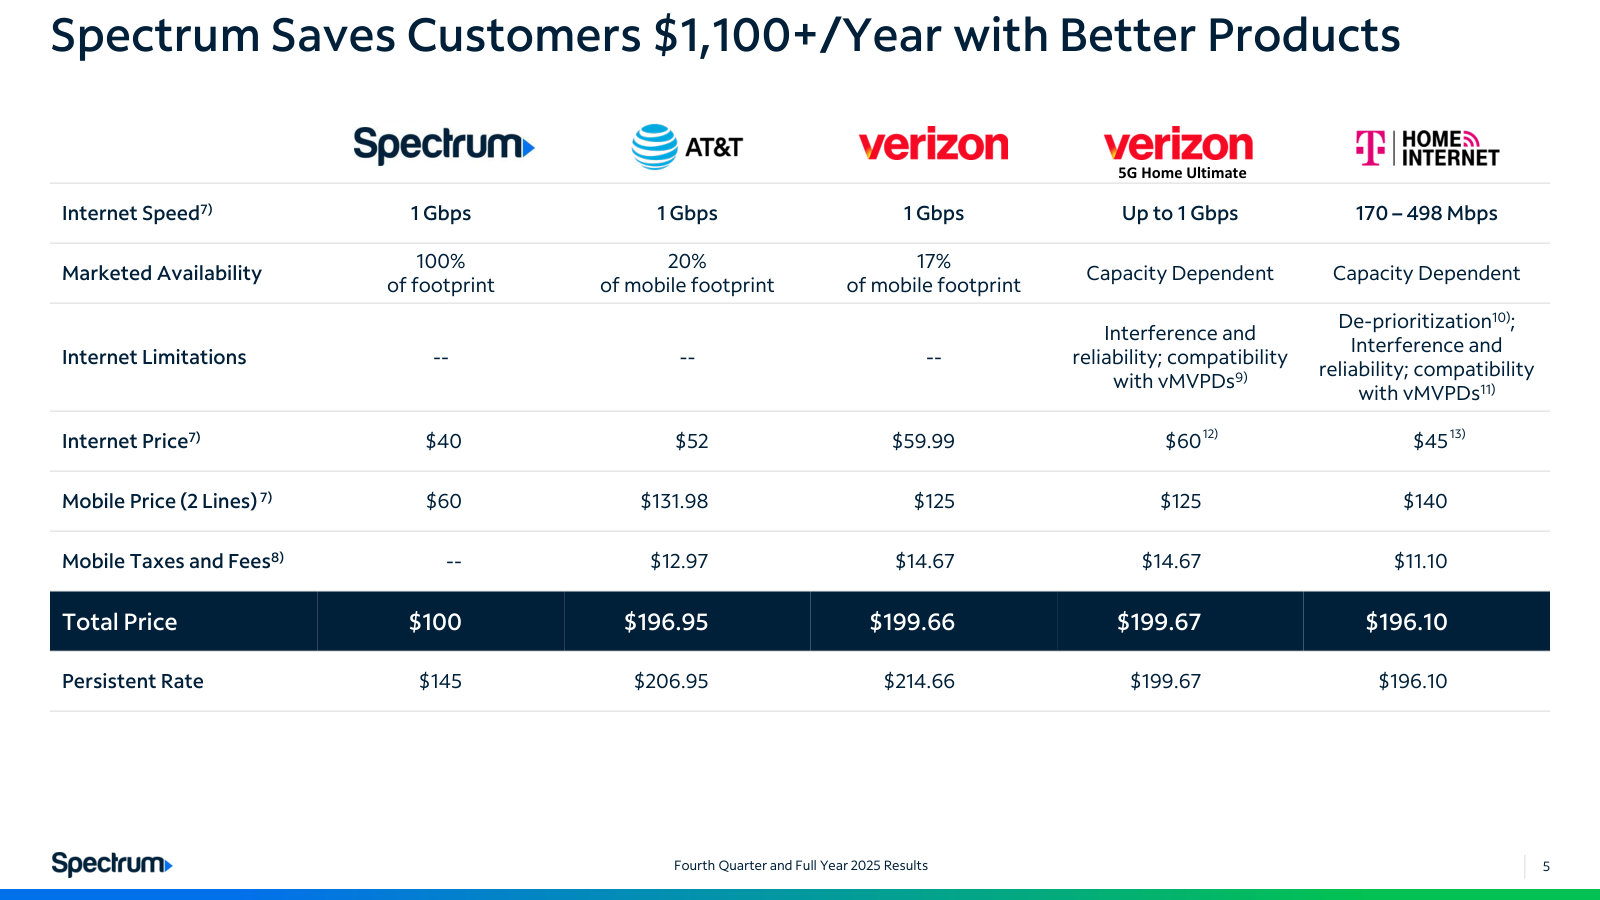
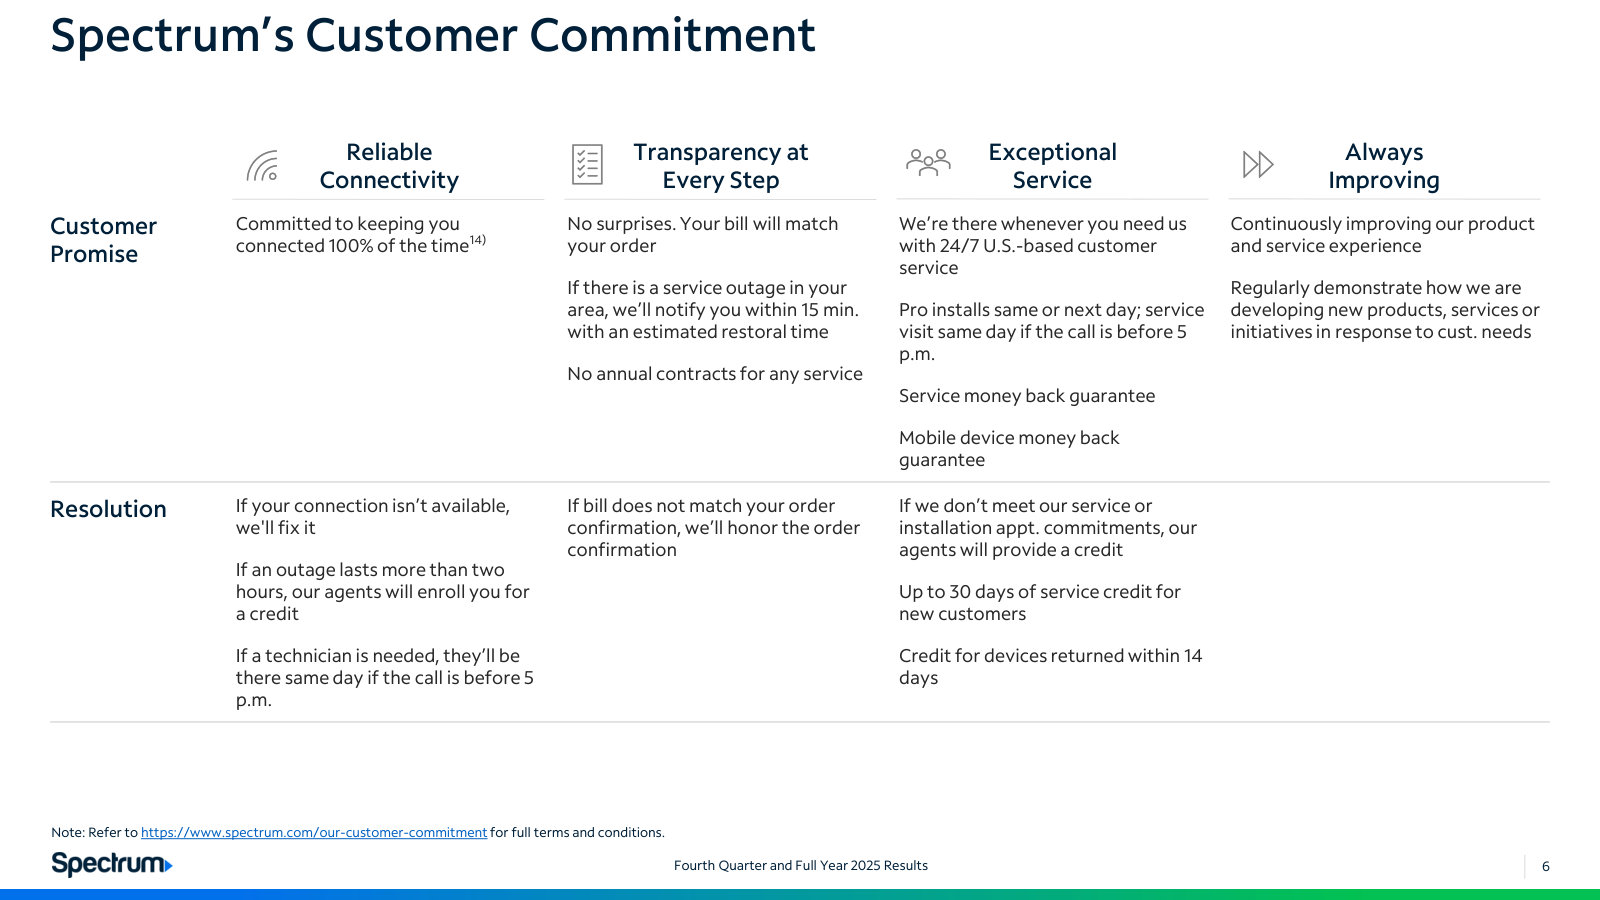
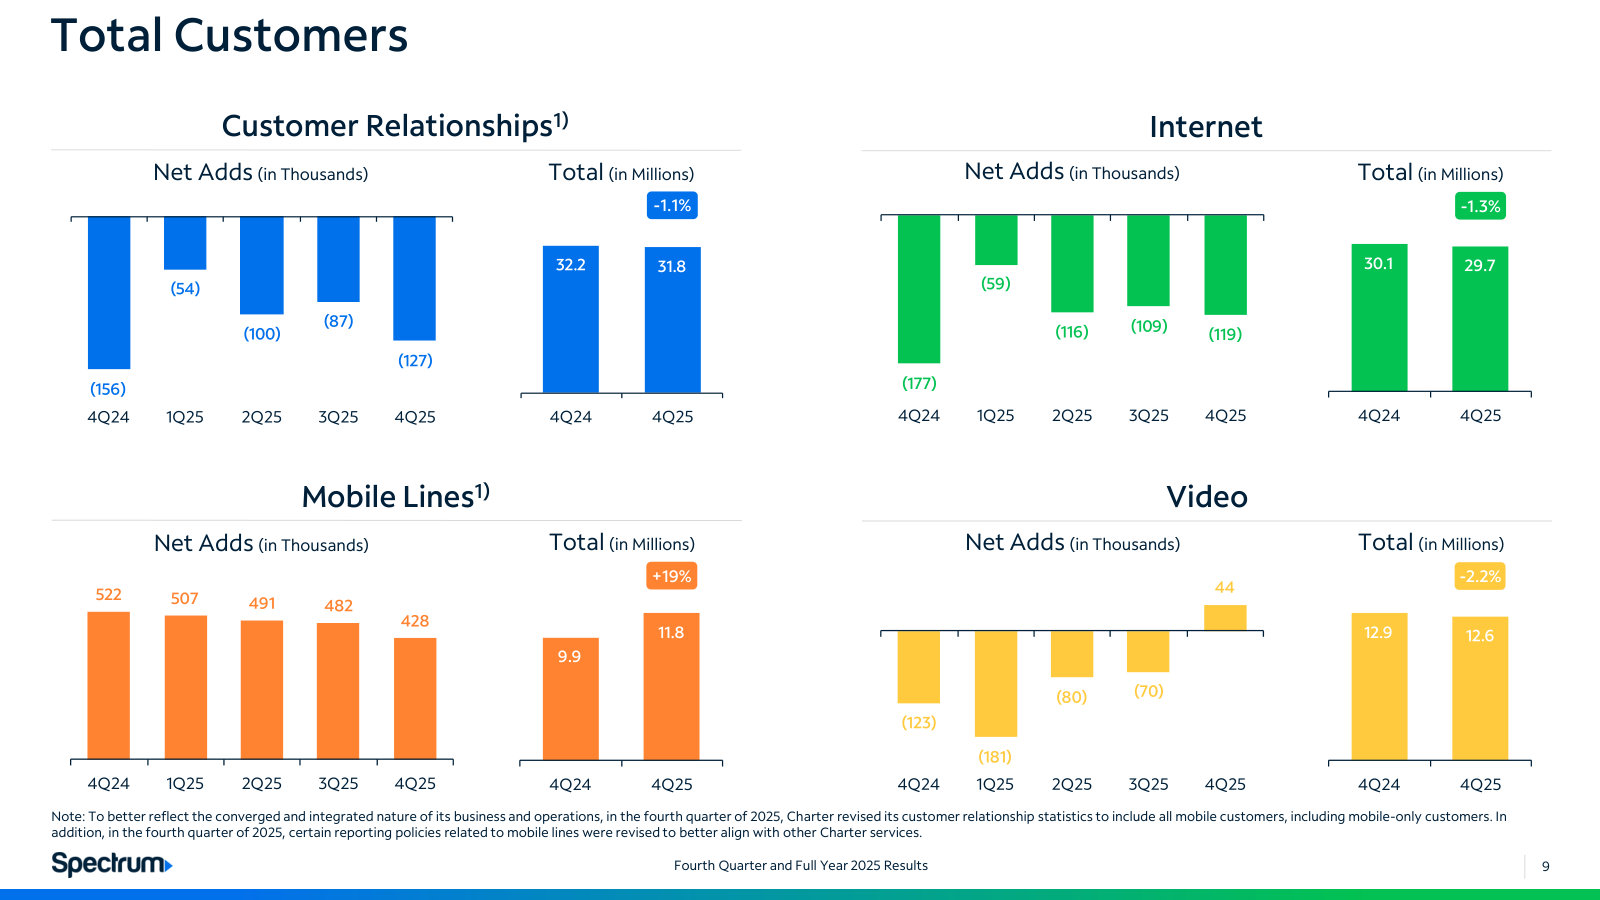
Third Quarter 2025 Results — 3Q 2025
Included for two explainers later decks dropped: the mobile margin per line and the shift of the video base to IP. · Open the full document →
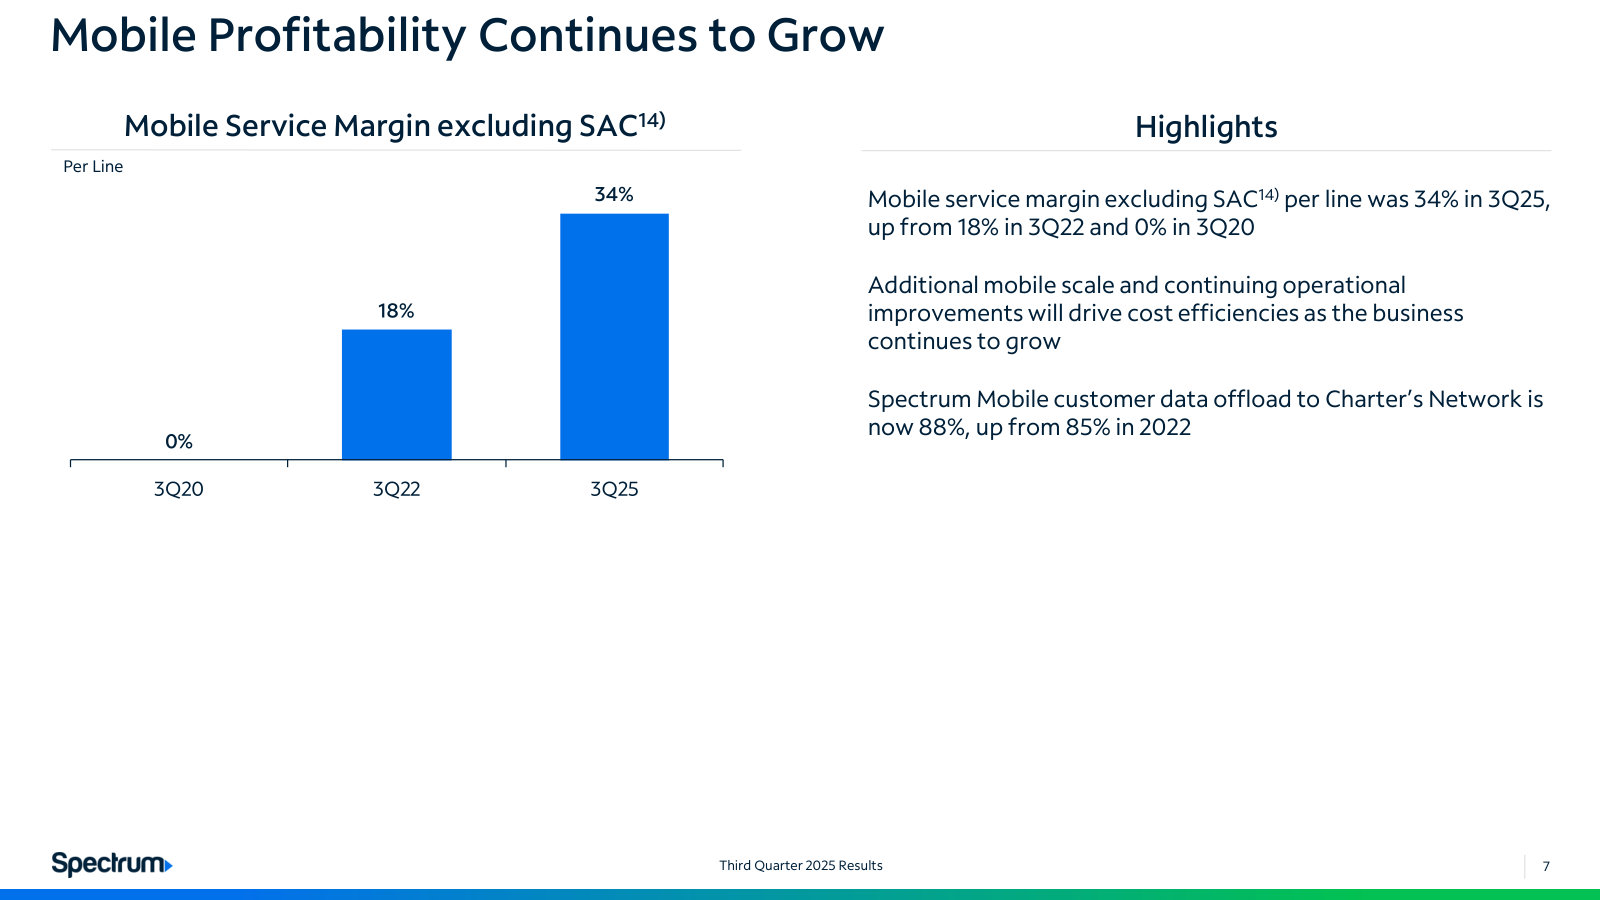
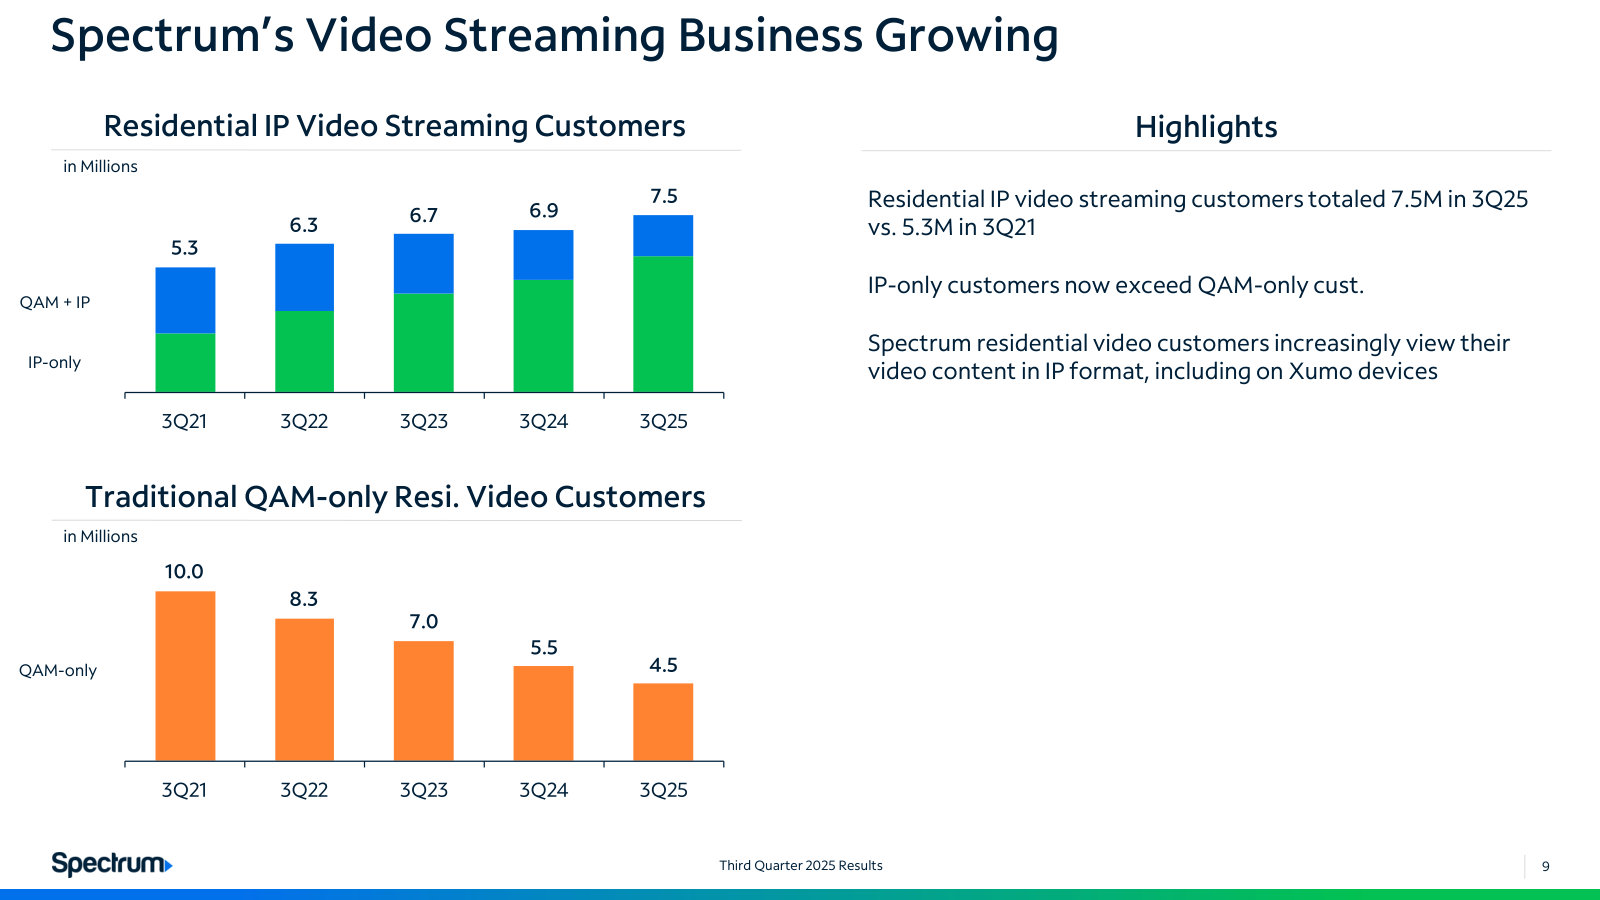
Charter and Cox Communications Agree to Transformative Combination — 2025
The Cox combination as management presented it: terms, pro forma scale, structure, ownership and governance of the company Charter becomes. · Open the full document →
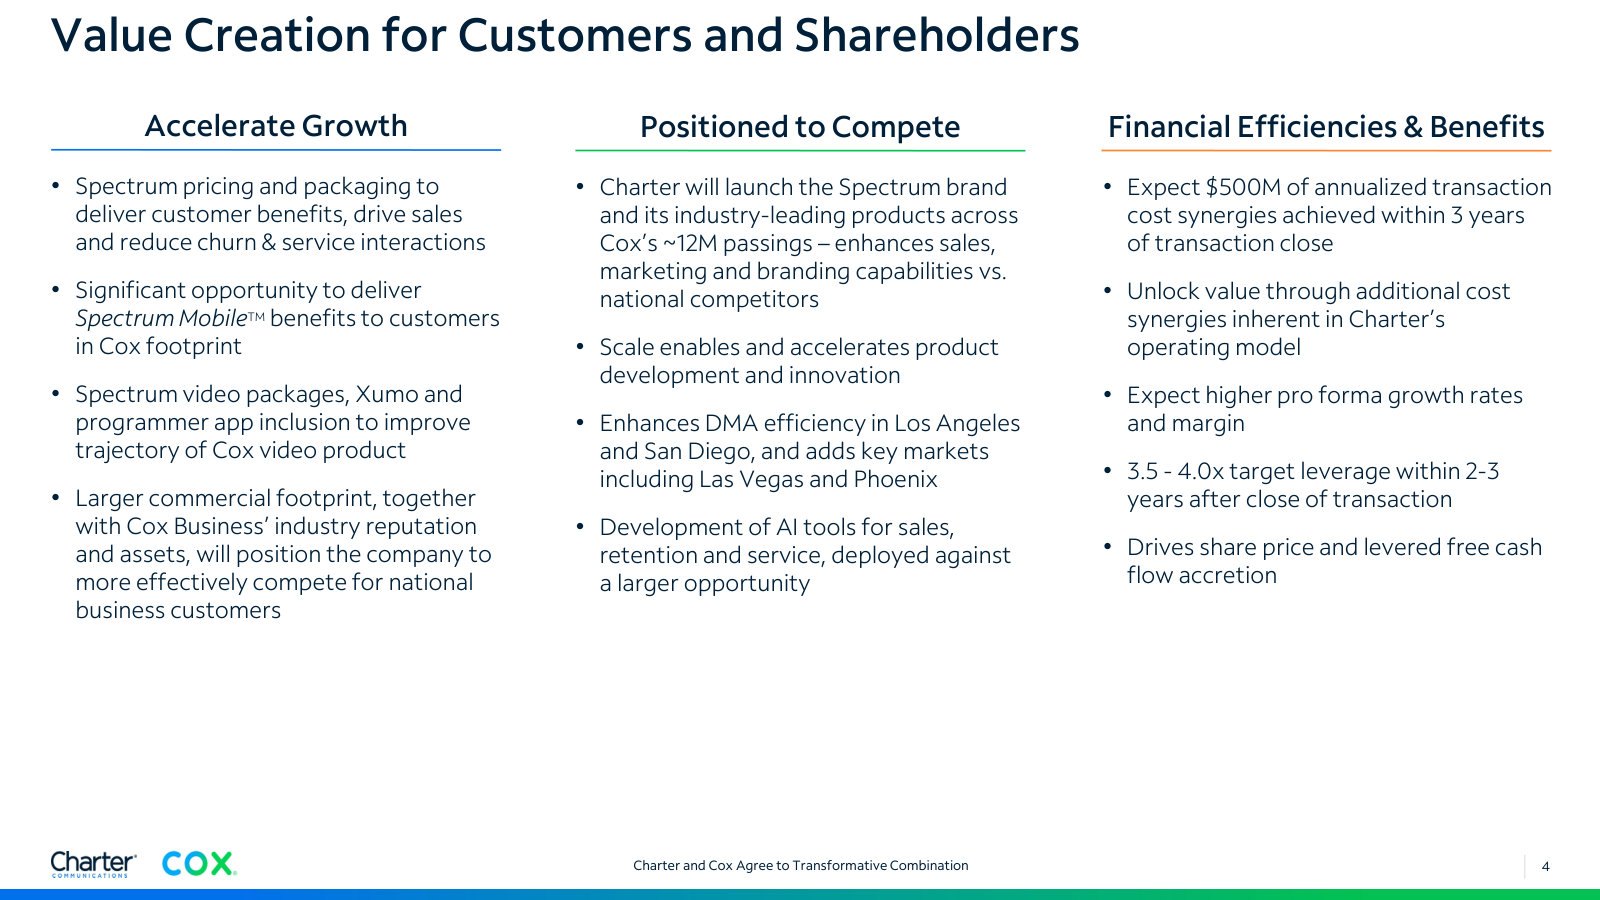
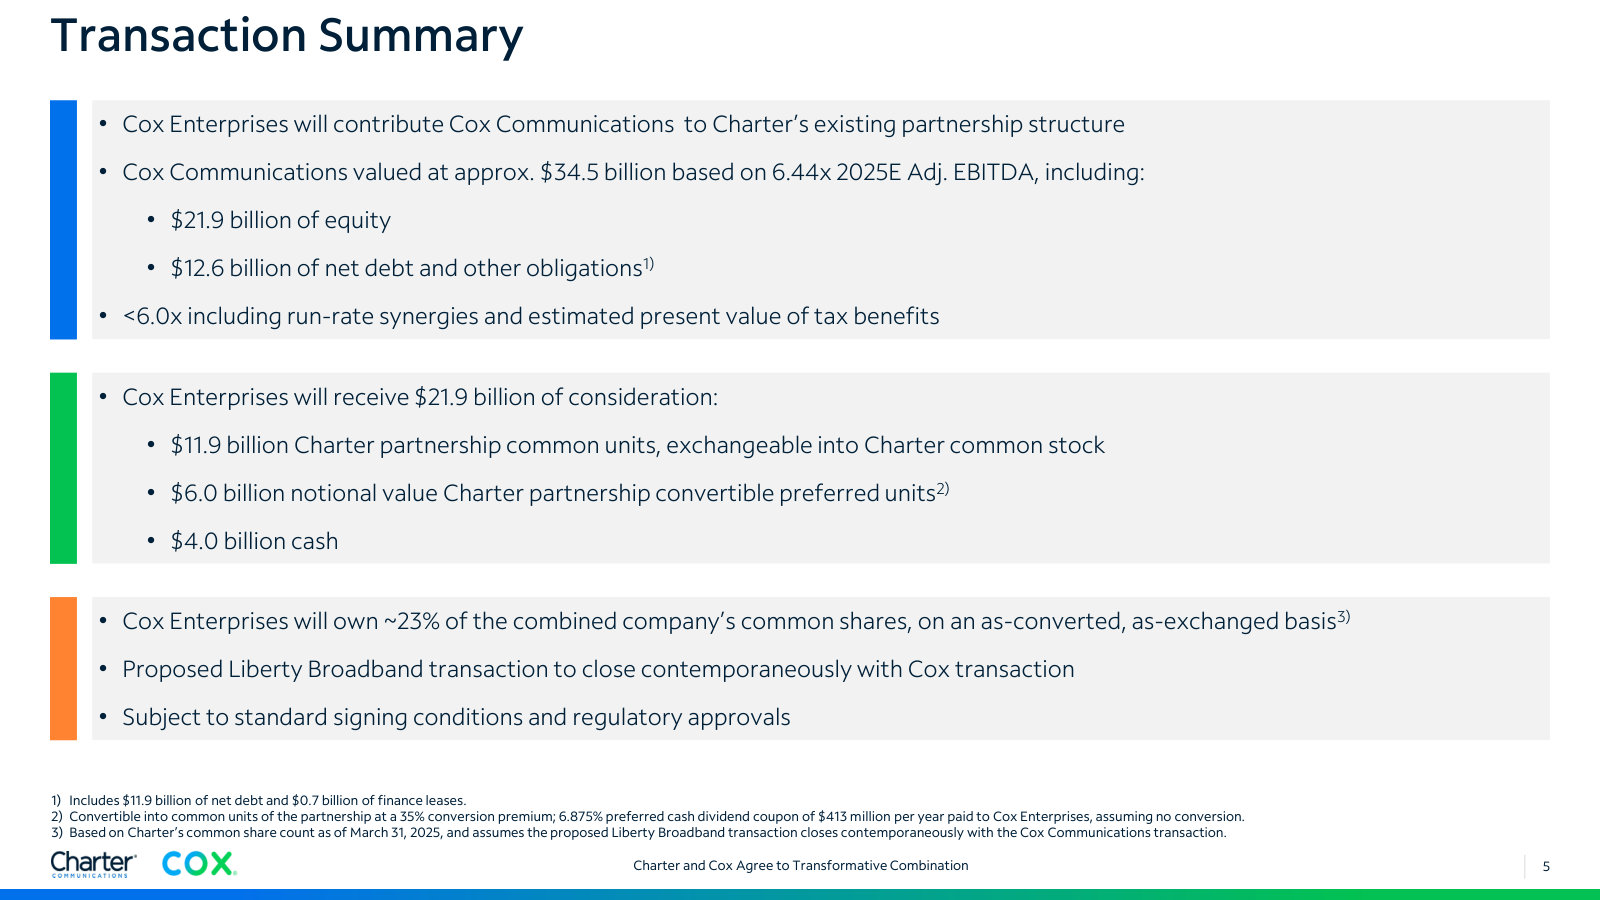
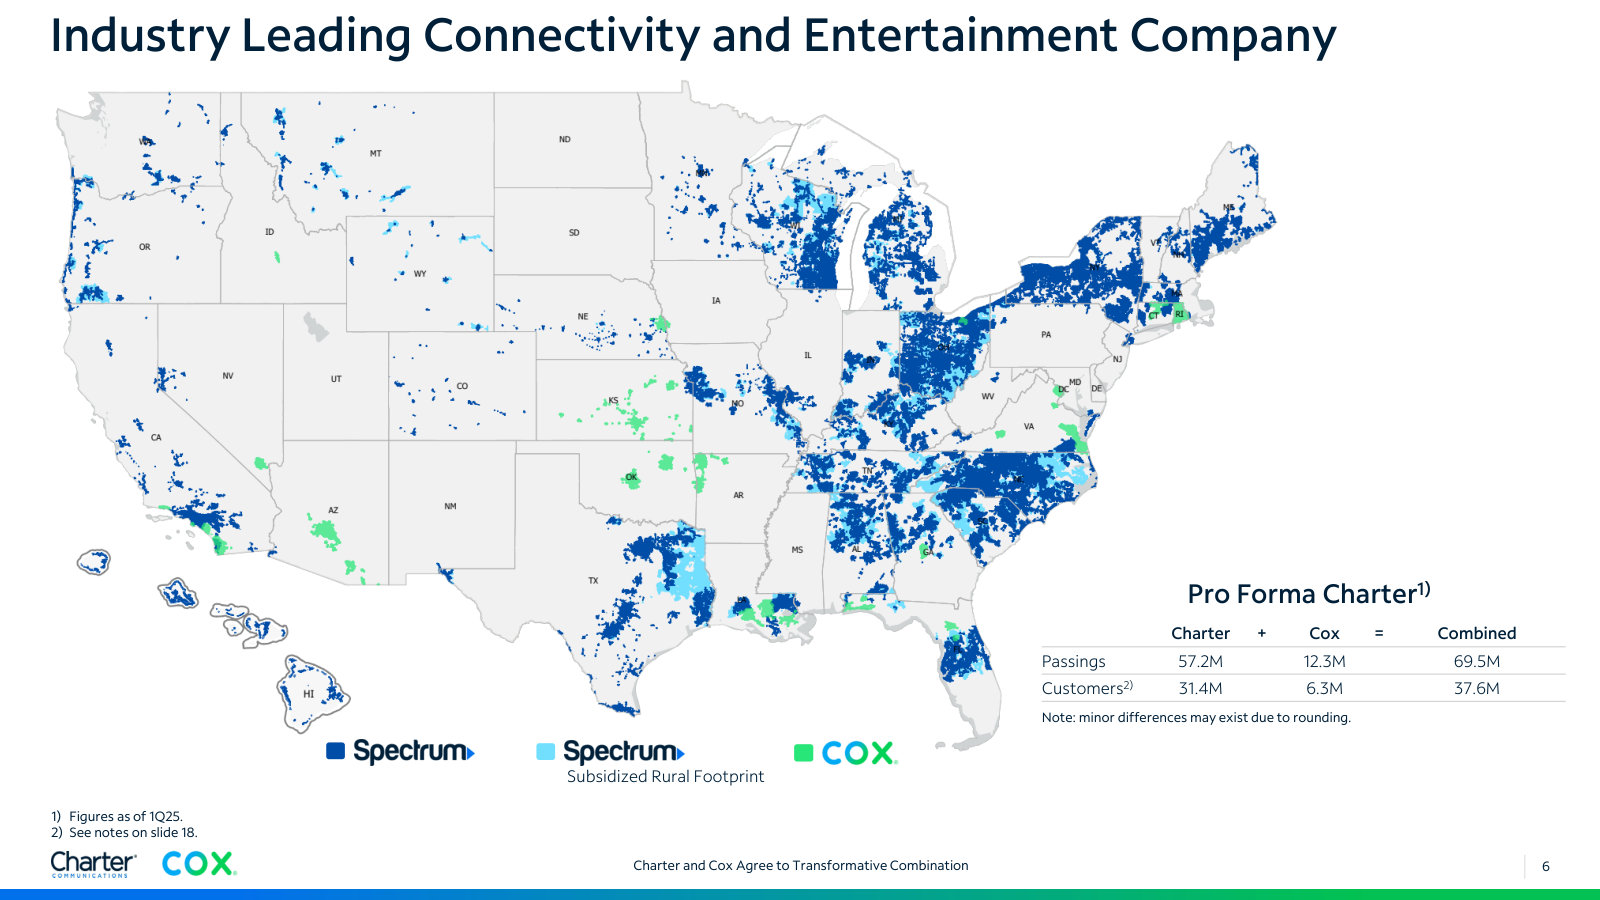
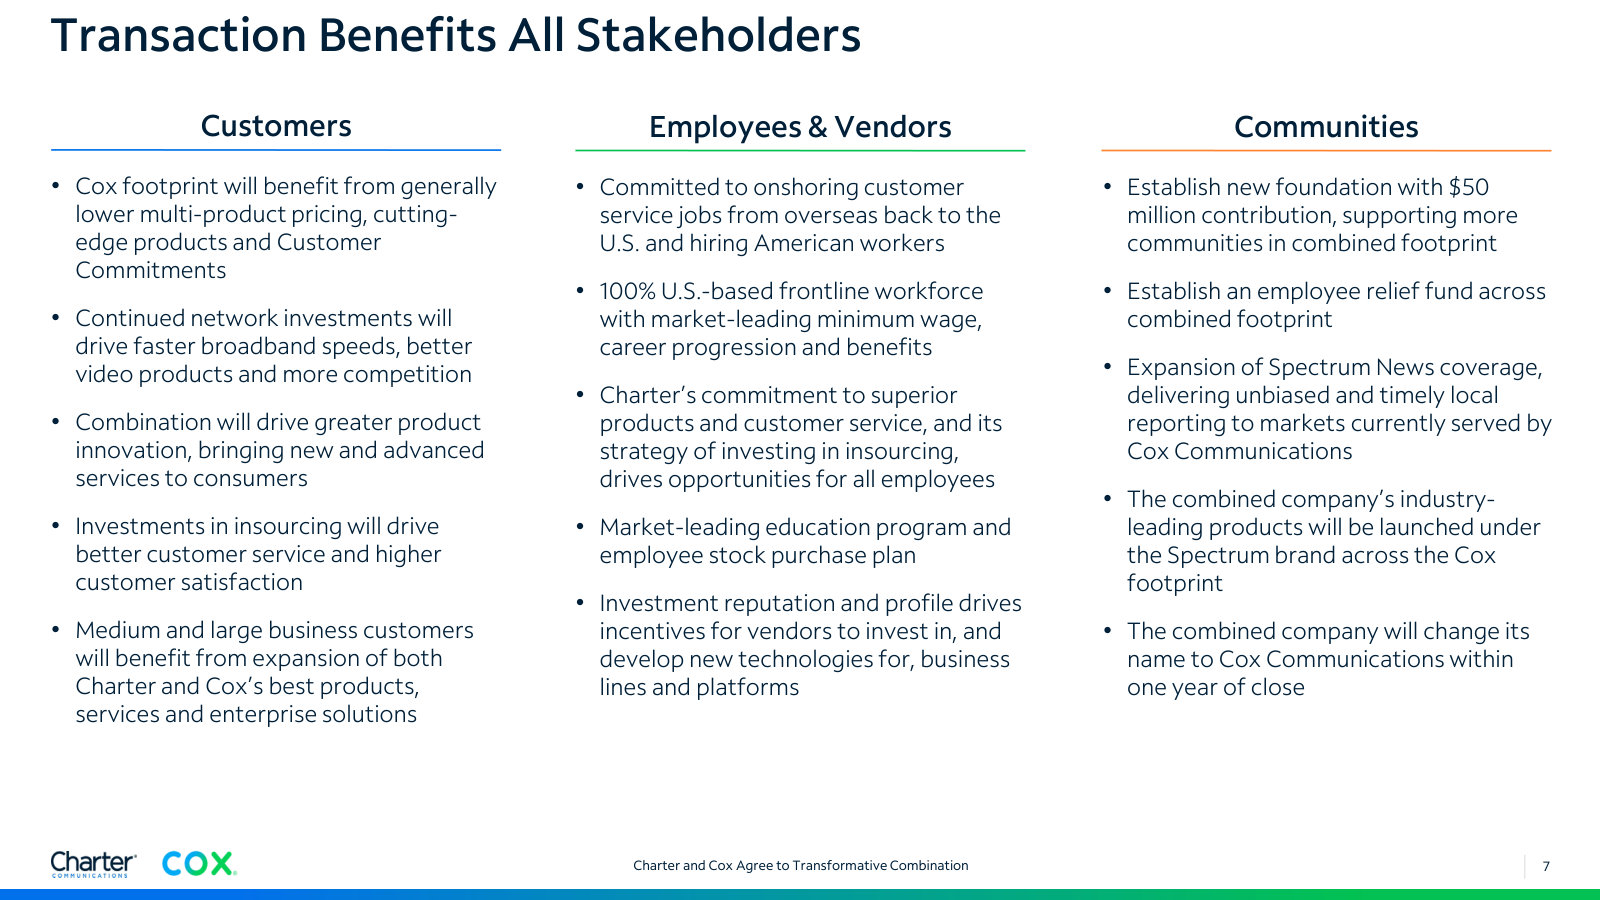
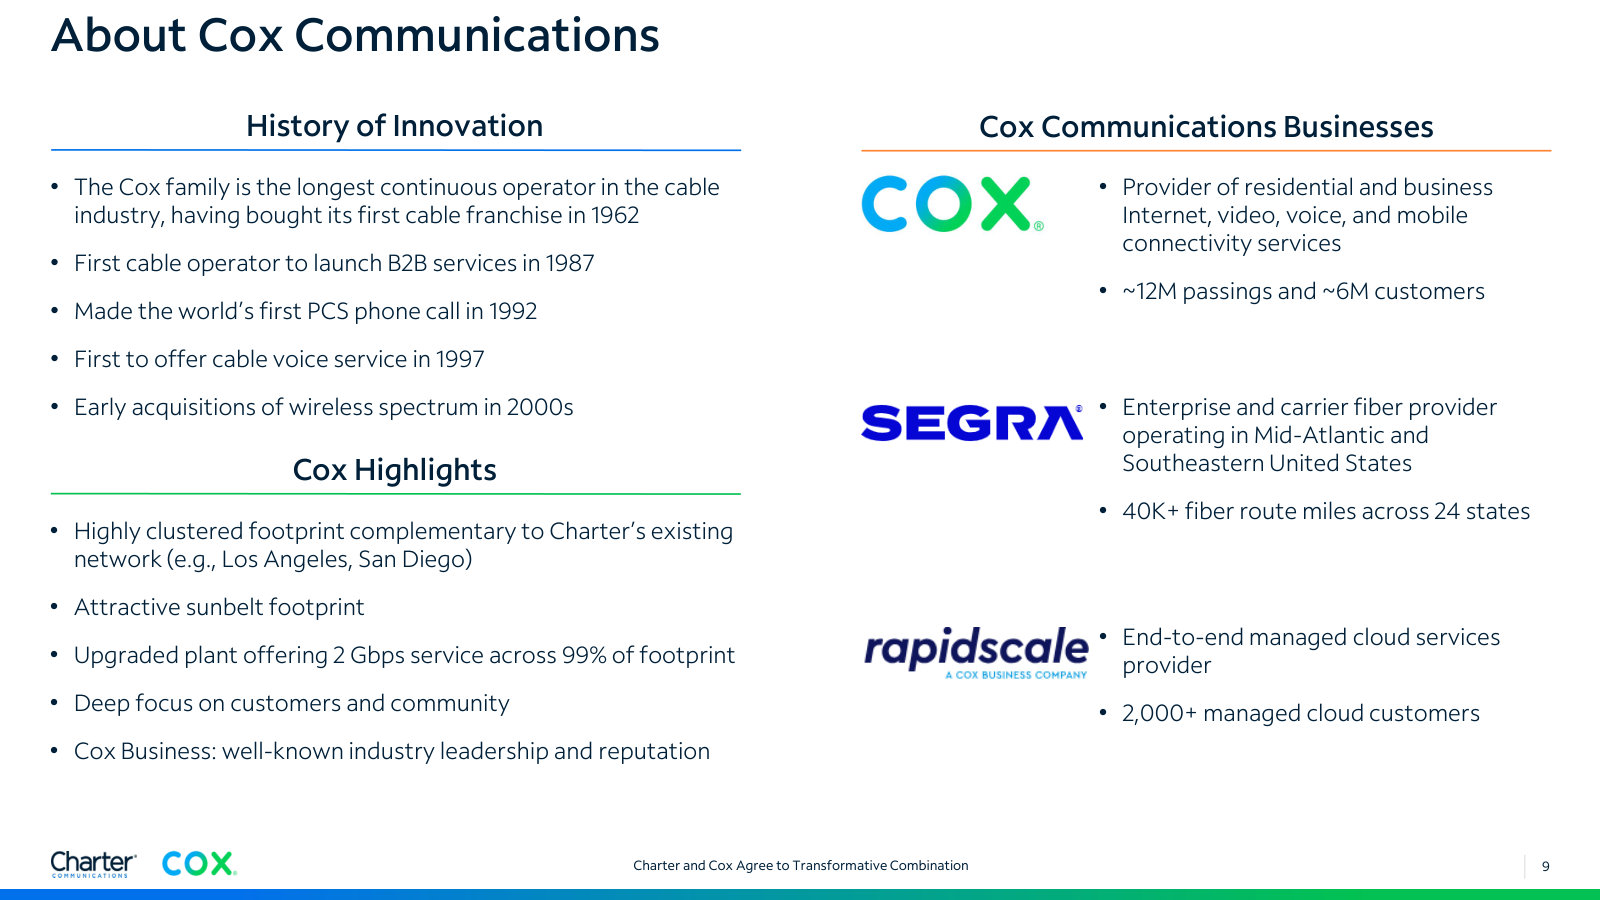
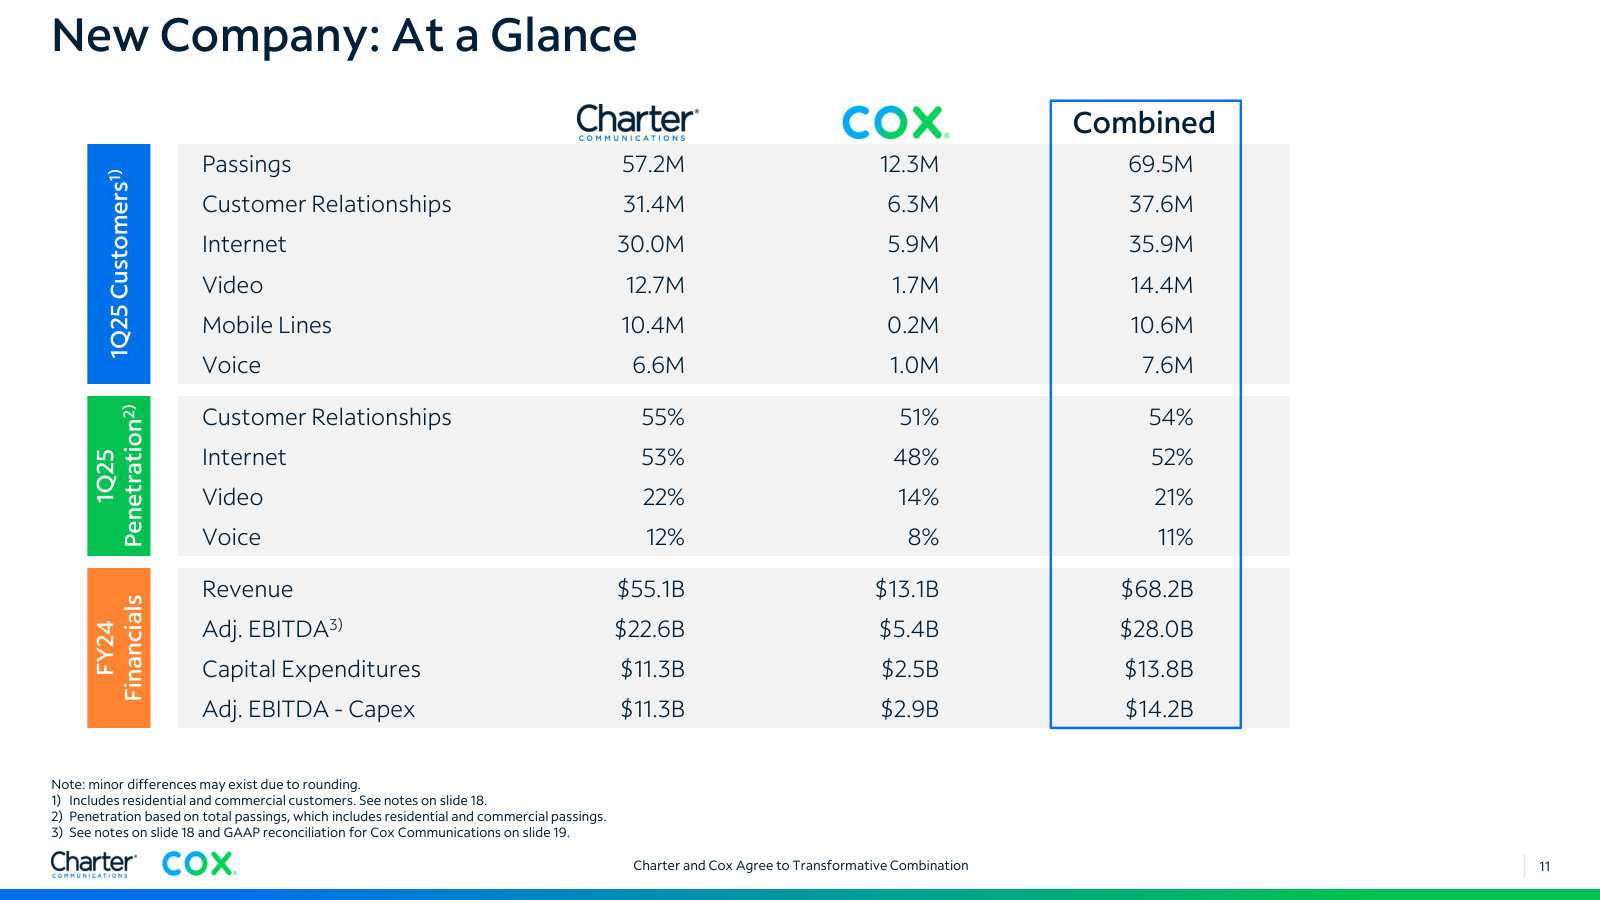
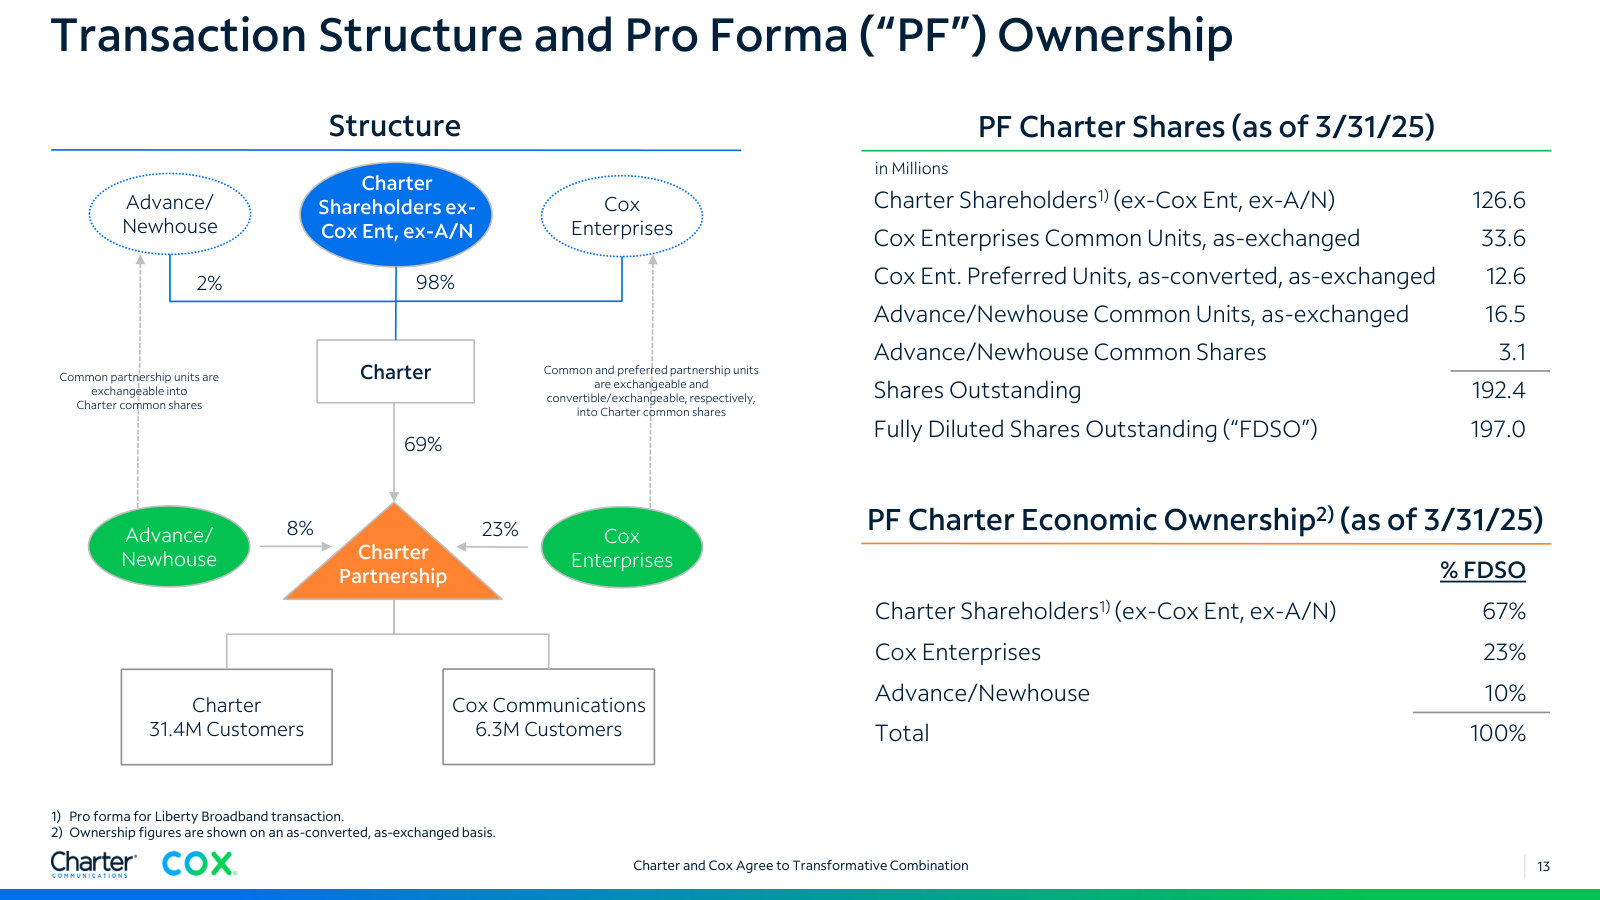
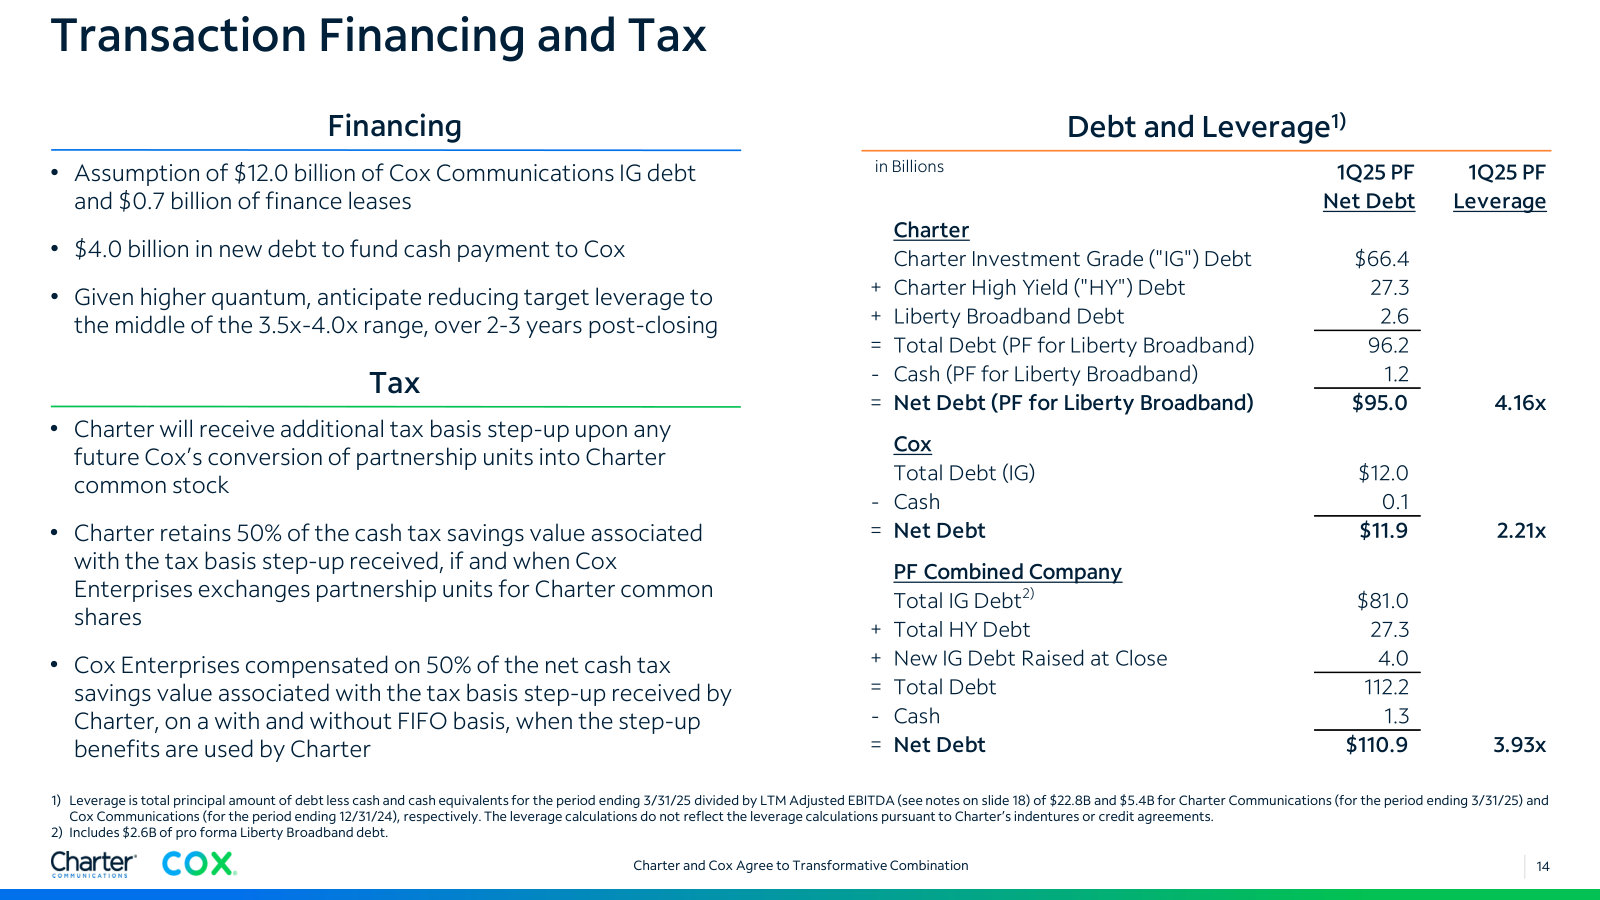
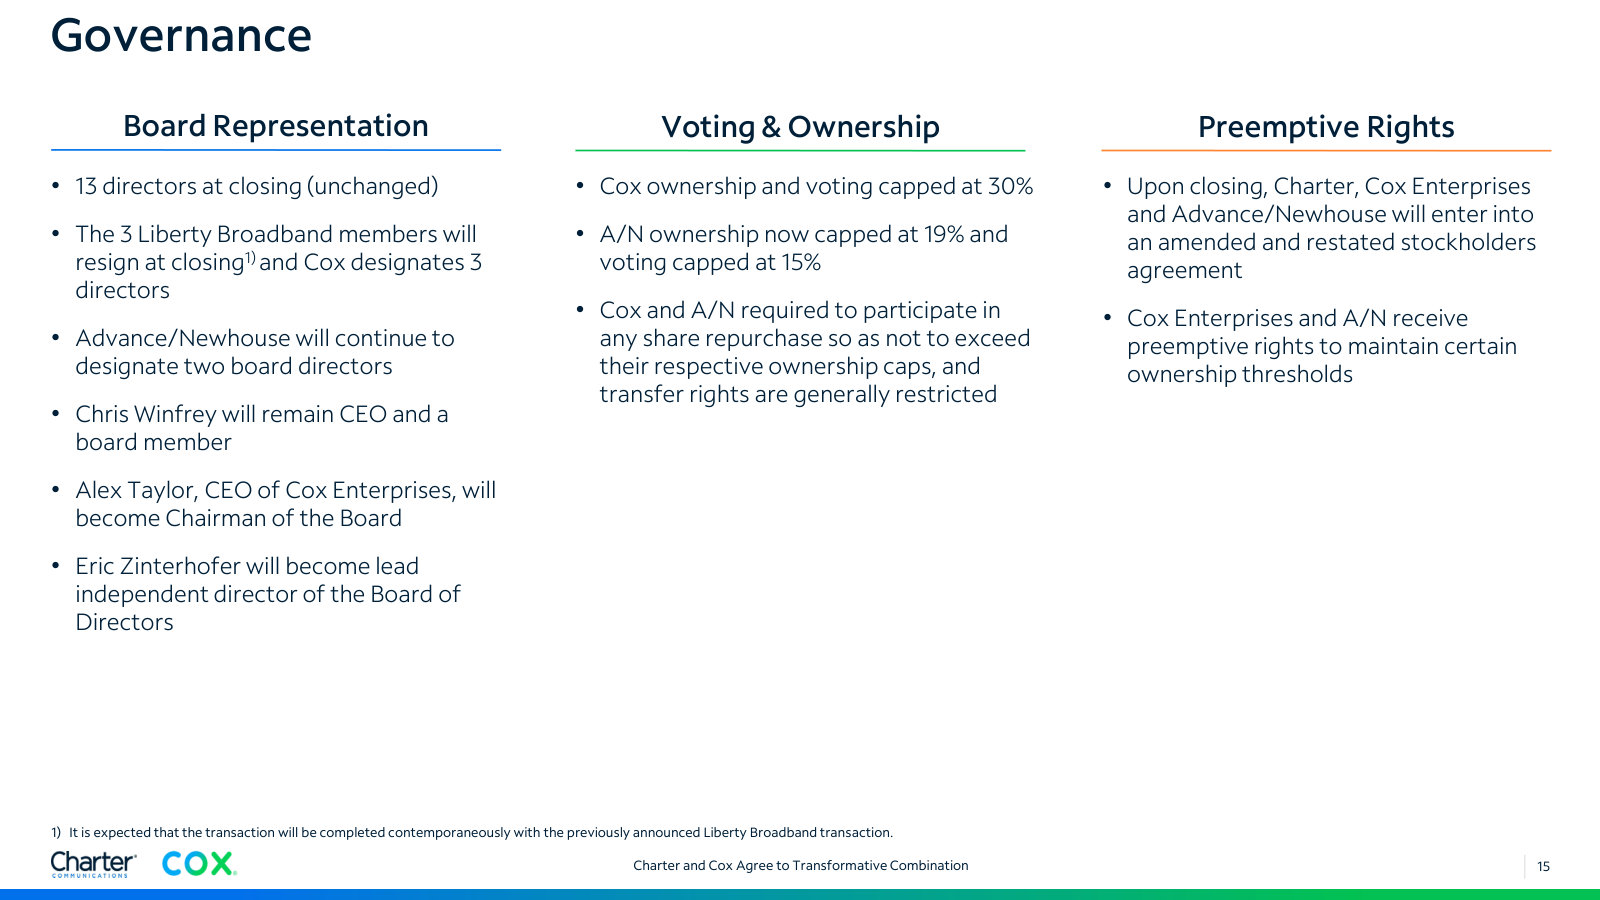
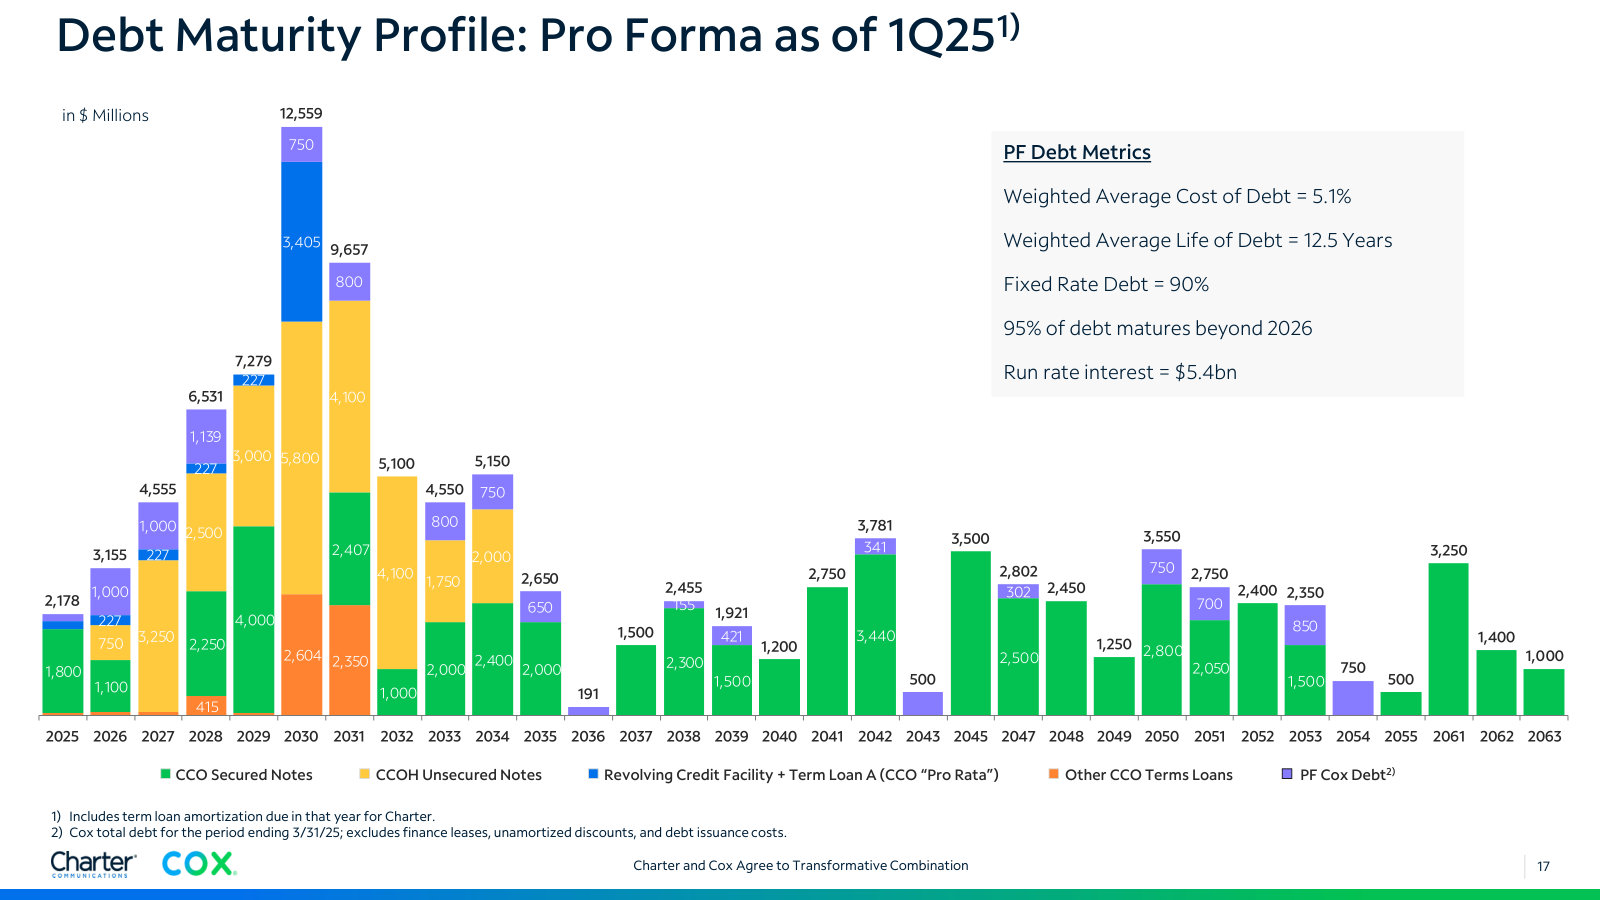
More from management
2Q 2026 Trending Schedule — 2Q 2026 · 6 pages · Nine quarters of customer, ARPU, revenue, capex and rural-build detail in one set of tables — the source behind the deck charts. · Open →
Debt and Capital Structure Supplement — As of June 30, 2026 · 7 pages · Instrument-level debt schedule, maturity stack and the secured/consolidated leverage path since the Time Warner Cable deal closed. · Open →
Fourth Quarter and Full Year 2024 Results — FY 2024 · 20 pages · The pre-Cox baseline year and the capex outlook, ex-BEAD, that the current multi-year plan was revised from. · Open →
Third Quarter 2024 Results — 3Q 2024 · 16 pages · Where the new pricing and packaging structure and the programmer app inclusion economics were first laid out. · Open →
Fourth Quarter and Full Year 2023 Results — FY 2023 · 25 pages · The subsidized rural construction programme in detail, and the original multi-year capex ramp that peaked in 2025. · Open →
Charter Communications, Inc.'s management answers for the business every quarter. These are the exchanges that explain it best — verbatim, from the call transcripts preserved in Sources. Each link opens the full transcript at that page in a new tab.
Q2 2026 Earnings Call — Q2 2026
Standalone Charter on the eve of the Cox close: why broadband still shrinks, why free cash flow does not, and a lower leverage target with the buyback paused. · Open the full transcript →
The core claim of the equity story: subscriber timing is unpredictable, the capex-driven cash flow ramp is not.
Christopher Winfrey (President and CEO): Softer gross additions remains the primary driver of our Internet customer growth weakness, while churn remained largely unchanged. And while Internet customer growth is taking longer to reverse, the growth of new competition will subside, we expect to stabilize and return to broadband growth over time with our better converged connectivity product and pricing, higher demand for speed, data and reliability and as our NPS scores improve, benefiting both churn and sales. The timing of all that is hard to predict, but our cash flow growth is not, and we have full confidence in the significant free cash flow ramp we're about to see.
p. 1 · Read in context →
The bundling math behind the strategy — what mobile, video and app activation each do to broadband churn.
Christopher Winfrey (President and CEO): Internet customers that also purchase our mobile product churn nearly 40% less than Internet customers who don't have mobile. And the more lines per account, the greater the churn reduction. Today, our mobile customer penetration of Internet is about 20% with an average of just below two lines per mobile customer. So significant upside remains for mobile penetration and lines and broadband churn reduction. Internet customers that purchase our video product similarly churn over 40% less and activation of our programmer app inclusion offer further reduces churn across all broadband relationship tenures. Currently, 55% of our eligible video customers have activated at least one of our inclusion apps with over four apps activated on average.
p. 1 · Read in context →
The combined company sized in one paragraph: passings, revenue, EBITDA, and an 8% mobile share of its own footprint.
Christopher Winfrey (President and CEO): Following the closing of the Cox transaction, I want to frame what we'll represent as an industry partner for innovation. We'll have roughly 1.3 million miles of network with over 70 million passings with a fully converged multi-gig Internet and mobile offering available to all of those passings. We'll have approximately 37 million customers, meaning a selling opportunity of nearly 35 million passings without a relationship today. Together, we'll generate approximately $67 billion in revenue and approximately $28 billion in EBITDA. Spectrum will operate under two MVNOs with the best mobile networks in the country and the only fully converged capability in our footprint. Today, there are approximately 164 million mobile lines in our footprint and only 13 million of those will be Spectrum Mobile, 8% penetration with a faster, lower-cost mobile product. So while we're growing mobile quickly, there's still a very large growth opportunity in front of us.
p. 2 · Read in context →
Leverage target cut to a flat 3.5x within three years of closing — framed as investor feedback, not a change in confidence.
Christopher Winfrey (President and CEO): Turning to capital structure. Jessica and I listened to feedback, and we heard both equity and debt investor preference for lower leverage despite our significant free cash flow and continued capital return. So today, we're moving our post-transaction leverage target to a flat 3.5x, which we expect to achieve within three years following the close of the Cox and Liberty Broadband transactions. And we're taking a multifaceted approach to delevering, which Jessica will discuss in a few minutes. But the plan is to both delever earlier and further, but not forgo the buyback opportunity at what is a historically low valuation. All of which provides a robust backdrop to a broad segment of shareholders and bondholders who benefit from our free cash flow growth and capital allocation.
p. 2 · Read in context →
Management's own arithmetic on what the capex step-down is worth per share, and the multiple it implies.
Jessica Fischer (CFO): For standalone Charter, we continue to expect total 2026 capital expenditures to reach approximately $11.4 billion. […] And after our evolution and expansion initiatives conclude, our run rate capital expenditures for standalone Charter would be below $8 billion per year. That reduction in capital expenditures on its own from approximately $12.1 billion over the last 12 months to less than $8 billion in 2028, is equivalent to over $30 of free cash flow per share based on our June 30 share count. If we take consensus, 2026 free cash flow for standalone Charter and substitute our expected 2028 CapEx for 2026 CapEx, our current stock price would imply a free cash flow multiple of a bit over 2x and a free cash flow yield of nearly 50%.
p. 4 · Read in context →
Why they refuse to be held to broadband ARPU — and Winfrey owning the retention-offer bet that cost them the quarter.
Craig Moffett (MoffettNathanson); Jessica Fischer (CFO); Christopher Winfrey (President and CEO): First, Jessica, a while back you said, I think it was two quarters ago, you guided to positive broadband ARPU for the year. I wonder if you could just update us on your outlook for broadband ARPU for the year. […] Sure. So Craig, I'll start with ARPU. Broadband ARPU will improve sequentially in Q3. The use of more aggressive retention offers, as I said, lessened through 2Q and largely normalized in June. We're still feeling the impact from some of those more aggressive offers in 2Q, and we will over the course of the rest of the year, but the impact isn't building in the same way at this point. And we'll have a tailwind from the rate for the cost pass-through that's hitting in late July and early August. I understand the sensitivity and the rationale for the focus around broadband ARPU. But I remind people, we don't manage the business for product level ARPUs. Our focus is on penetration as well as connectivity ARPU and overall customer relationship ARPU excluding the programmer app allocation, both of which I think will grow in FY '26. […] The pressure that we had inside of Q1, which carried through Q2 really was a bet at the time that you can get a substantial lift through putting in that retention. And it had some impact, but not enough to really merit what we did. So we pulled back. I own that.
p. 6 · Read in context →
The direct answer to what changed in six months to lower the EBITDA target: offers that didn't work, plus fuel and medical.
Vikash Harlalka (New Street Research); Jessica Fischer (CFO): You've changed your goal for EBITDA for the year. I just wanted to ask what changed in the first six months for you to lower your target for EBITDA. […] So on the EBITDA side, I think some of what changed, and Chris described a bit of it was expectations around broadband subscribers and ARPU over the course of the year based on some of those things that we had done around offers that we thought might work, but that didn't work out as well. There's also a little bit of pressure in some controllable expenses, things like fuel and medical, where we haven't been able to sort of make adjustments against those in the same way as you can some others. We do have the ability and we've done quite a bit to think about expenses for the second half of the year and how we can be in a better place. And so as Chris said, we've made some changes around moving price adjustments through. We are doing some work around driving down expenses across the business and in some cases, we're making some changes to benefit plans to bring them more in line with market and to doing some simplification on the overhead side that I think makes a lot of sense and that's rolling through now. So we continue to have levers and we'll continue to push to be in a better place than that trajectory as we get through the year.
p. 7 · Read in context →
Asked by LightShed whether to help fund a wireless build, Winfrey argues Charter already is the largest facilities-based one.
Christopher Winfrey (President and CEO): Stepping back, we're committed to a capital-light approach that makes sense for mobility and delivering converged retail services. We have great partners — Verizon, principally on the residential side, which has been an excellent partner with a strong network — and we've recently launched on the B2B side and are incrementally moving forward with T-Mobile, which is also a fantastic network and a capital-light fit for us. That arrangement lets us add new product features on the business side that we didn't have before, sell many more lines, and move upstream into that space. Both partners have been great and the launches have been pretty seamless, so we're pleased. There is no pressing need for us to build any kind of network because we already have one. To put it another way, and not to be provocative, I view us as the largest facilities-based wireless provider in the country. We offload roughly 87 to 88 percent of our own traffic, and WiFi is the workhorse of Spectrum and data delivery across our footprint. WiFi likely carries 75 to 80 percent of traffic for the mobile network operators, so our wireline and WiFi facilities provide wireless offload for us and for the major telcos. Given that, and the partnerships and economics we have today, I don't see a need for us to pursue that remaining roughly 12 percent.
p. 10 · Read in context →
Q1 2026 Earnings Call — Q1 2026
The fullest account of the Cox playbook — what changes in those markets at launch, and why customer ARPU rather than broadband ARPU is the number to watch. · Open the full transcript →
The migration engine, quantified: 45% of the base repriced, app activation cutting video-customer churn by a third.
Chris Winfrey (President and CEO): We launched our $1,000 savings guarantee in February, which demonstrates the value we deliver in a very clear way. If you sign up for Spectrum Internet and switch two or more mobile lines from Verizon, AT&T or T-Mobile, we guarantee $1,000 of savings in your first year, or we'll cover the difference. We also recently launched a new Digital Buy Flow for the online channel; it better demonstrates our bundled value and savings versus competitors, and the new Buy Flow is achieving better yield. We're also actively migrating our existing base of customers to our newer pricing and packaging, giving them more product, including Internet speed increases and mobile, for the same price or slightly more than they're paying so they get more value, creating higher satisfaction and reducing their propensity to churn. Roughly 45% of our residential customers are now in the pricing and packaging launched in late 2024. With respect to providing superior utility, over 50% of our expanded-basic video customers have activated at least one of our included streaming apps; those activating take nearly four streaming apps on average. Customer churn for expanded-basic customers who activate is one third lower, and it is meaningfully lower across all customer tenure.
p. 2 · Read in context →
The overlooked half of the Cox case: similar margins today, but Cox's cost base is marginal, not a full overhead structure.
Jessica Fischer (Chief Financial Officer): I mean, Chris said that the average revenue per customer is not that different from where we sit. The other interesting thing is that the EBITDA margin is also not that different from where we sit today, even though broadband makes up a much larger portion of their revenue than it does of ours, which might have linked itself to a different cost profile. So we have some space if we move the operating cost structure to look more like ours over time and in particular, as you move it that way, recognizing that it's a marginal additional business rather than an entire business that you have to fully replicate an overhead structure for. There's plenty of space to then create room for that change that you make in the revenue stream over time as well.
p. 7 · Read in context →
Where they stand on LEO satellite as of early 2026 — no measurable share loss, and a possible partner.
Chris Winfrey (President and CEO): On satellite, I would just say we don't underestimate any competitor, particularly one that is as well capitalized and innovative as these players. But so far, our tracking in data doesn't suggest a significant customer share loss to satellite. In some subsidized rural markets, we may have seen satellite precede us and that has an impact, but in general, our subsidized rural footprint is hitting targets. I think long term, satellite can be a great product where density is low. From a national broadband coverage standpoint, there may be areas where satellite is an appropriate complement. There could be more opportunities to cooperate than to think of it purely as a direct competitor in suburban and urban environments. We've already integrated 5G as backu service through Invincible WiFi; there are other ways to attach satellite and possibly resell that product as part of our offerings. So we keep a close eye on it, and so far we don't see a major impact; it could be more friend than foe.
p. 9 · Read in context →
Q2 2025 Earnings Call — Q2 2025
First full call after agreeing to buy Cox, with the strategic case for it, the tax change that reset free cash flow, and the integration playbook from prior deals. · Open the full transcript →
The point at which mobile stopped consuming cash: profitable without handset subsidies, now funding free cash flow.
Christopher L. Winfrey (President and CEO): From a financial perspective, mobile EBITDA less mobile CapEx is positive. And for the last couple of quarters, that figure has been positive, even including the impact of customer device financing. Outside of our multiline phone balance buyout, we don't see a need to subsidize acquisition given our market-leading speed and value. So the mobile business is now becoming a real tailwind to our free cash flow growth, and it will continue to increase.
p. 2 · Read in context →
The Cox case as management first framed it: valuation, accretion to levered free cash flow per share, and who else benefits.
Christopher L. Winfrey (President and CEO): A logical expansion of our strategy was our announcement in May to acquire Cox Communications. This combination offers significant benefits for customers, employees, local communities, and shareholders. The transaction will marry Spectrum's operating strategy with the B2B capabilities and community investment heritage of Cox, together with our shared philosophy of long-term investment in our network and employees. It will bring Spectrum products and prices to the Cox footprint, where we don't operate today, increasing competition in those market to the benefit of consumers and increasing onshore labor to the benefit of employees. This transaction is good for America. It's also a great outcome for both our current shareholders and for the Cox family. The transaction is priced at an attractive valuation, and it's accretive to top-line growth, margin, and to levered free cash flow per share, even when absorbing the impact of a modest delevering of the combined business and without factoring in the benefits of a lower cost of capital and the value of Cox as a sophisticated long-term shareholder.
p. 3 · Read in context →
What the July 2025 tax law did to the cash flow model — roughly $10 per share a year for six years, by their math.
John Christopher Hodulik (UBS); Jessica M. Fischer (CFO): First, for Jessica, thanks for the numbers on the tax reform. Do you have a number for '26 and maybe more detail on the sort of the use of the cash tax savings? […] Yes. So I'll start on the tax question. As I said in the change to the guidance this year, we did come down pretty dramatically in our expectations for 2025 cash taxes. We expect several billion dollars in the next five years. And if you look at what piece of that is in 2026, I think it's reasonable to assume that there's savings that's similar to or slightly larger than what we saw in this year. I mean I think the big story is around sort of what it does to overall free cash flow. And in our modeling, the new rules can drive $10 or so of free cash flow per share for each of the next six years. So I think the impact is pretty dramatic.
p. 6 · Read in context →
The repricing playbook from Bresnan, Time Warner Cable and Bright House, applied to a base with higher broadband ARPU.
Steven Lee Cahall (Wells Fargo); Christopher L. Winfrey (President and CEO): So Chris, you all have a lot of experience buying and integrating, including on the customerfacing side with your historical acquisitions. I think with Cox, the Internet ARPU is above Charter. So can you just think about how you're thinking about managing that transition when it comes? I imagine you're going to see a lot of customer touch points. It's probably an opportunity to sell in more services. So maybe you can just help us think through that. […] Regarding customer pricing and packaging integration, we have significant experience in that area. Looking back at past integrations such as Bresnan, Time Warner Cable, Bright House, and the original Charter in 2013, we noted that these integrations started with higher average revenue per user for broadband. Our goal was to transition those customers into more competitive packages without harming the company's finances. We achieved this by enhancing the value we offer to customers, whether through increased speed or improved quality of the Internet service, as well as through effective packaging and bundling for new customers. This approach has resulted in higher average revenue per relationship, despite lower Internet pricing. For existing customers, we typically introduce better pricing on individual products when they opt to add extra services, which historically involved video and wireline phone offerings. Now, the mobile service presents a powerful new avenue for achieving this, allowing us to save customers hundreds or even thousands of dollars annually by adding just a couple of mobile lines. Our ability to transition customers at their own pace and to acquire new customers with lower product pricing while achieving higher overall relationship revenue has been well demonstrated. Looking specifically at Cox, their video penetration is about half of ours, and their mobile penetration is just beginning to grow.
p. 11 · Read in context →
Q3 2024 Earnings Call — Q3 2024
The blueprint call: Life Unlimited, the service guarantees and the September 2024 pricing and packaging that every later quarter is measured against. · Open the full transcript →
The service guarantees spelled out, and the argument that prior spending on in-house labor is what makes them affordable.
Christopher Winfrey (President and CEO): Our new customer commitment is comprised of four key promises: Reliable connectivity—we're committed to keeping our customers connected 100% of the time and promptly resolving any issues. Transparency at every step—We're committed to clear and simple pricing and timely service updates. We will take responsibility when things go wrong. Exceptional service—We're committed to providing exceptional customer experiences. And finally, always improving, meaning we act on our customers' feedback to improve our products and customer service. We back up those commitments with guarantees. For example, to resolve any service disruptions quickly, we commit to dispatch a technician the same day if the customer requests prior to 5 PM. If a customer needs help with professional installation, a technician will be available the same or next day. We now back those commitments with proactive service credits if we miss the mark. We also don't have residential or SMB contracts. If a customer is not completely satisfied with any services within the first 30 days, we give them their money back. We're making these commitments because we can, because we've already made the investments in 100% US based sales and service with our own employees in frontline tenure through pay progression, market-leading benefits, and tools and systems to improve the job for the employee and our customers.
p. 2 · Read in context →
The pricing architecture still in force — $40 gig when bundled, multi-year price locks — and the model it serves.
Christopher Winfrey (President and CEO): Our Life Unlimited brand relaunch also includes new pricing and packaging that better utilizes our unique product assets, which work better together to provide lower promotional pricing and lower persistent bundle pricing. Our new pricing and packaging will drive more sales with higher selling of our best products, grow customer ARPU despite lower product pricing, and reduce billing, service, and retention calls, while reducing churn. For example, we now offer our gig internet product at $40 per month when bundled with two unlimited mobile lines and/or video. Customers that take the new double play will receive a two-year price lock, and customers that take our new triple play will receive a three-year price lock. In that package, customers also get our top mobile tier, Xumo, and Cloud DVR at no additional charge. For customers who want our popular Spectrum One offering, that remains available now with a higher starting speed of 500 megabits per second with one free unlimited mobile line included for a year. Existing customers can also opt into our new bundles at persistent bundled pricing. We have also increased internet speeds for existing flagship and ultra-customers. It's still very early, but so far, our new pricing and packaging is showing promising results, including more video sell-in, more mobile lines per sale, and more gig sell-in. I expect those results and broadband sales to accelerate as we season our marketing and sales approach over time. Our operating strategy remains simple: sell more products to more customers, driving higher penetration with our large fixed asset, reducing the operating capital cost per product with lower churn, to ultimately drive more cash flow capacity.
p. 2 · Read in context →
Why a shrinking video business was rebuilt rather than run off: app inclusion as a broadband acquisition and retention tool.
Christopher Winfrey (President and CEO): In video, over the past year, we transformed all of our major programming agreements in a way that works for our customers and for Charter, including a recent early renewal of Warner Bros. Discovery and then NBCU. These agreements give customers greater overall package flexibility and the ability to include all the key streaming apps from programmers within our Spectrum TV Select packages. This enables us to offer what we now call seamless entertainment— the first for the industry at no extra cost. […] By early 2025, we'll be providing our TV Select customers up to $80 per month of retail streaming app value at no additional cost, including the ad-supported versions of Max, Disney+, Peacock Premium, Paramount+, ESPN+, AMC+, Discovery+, BET+, and ViX. […] Fundamentally, we believe that maintaining and evolving the video business, even if it isn't growing, helps customer acquisition and retention by making use of our scale and capabilities and adding more value into our unique seamless connectivity relationship. Video still has positive cash flow and provides us with option value.
p. 2 · Read in context →
More calls
Q4 and Full Year 2025 Earnings Call — FY2025 / Q4 2025 · 10 pages · The annual capital-allocation call: capex laid out through 2029, capital intensity to 13%-14% of revenue by 2028, and the first cut of the leverage target to a 3.5x-3.75x range. · Open →
Q1 2025 Earnings Call — Q1 2025 · 10 pages · The high-water mark before the Cox agreement — 4.8% EBITDA growth, and the data-usage case for the network (825GB a month for non-video customers, 30% above a terabyte). · Open →
Q4 and Full Year 2024 Earnings Call — FY2024 / Q4 2024 · 12 pages · Go here for how the ACP wind-down actually ended (about 90% of former ACP customers retained excluding normal churn) and the multi-year capex outlook set after the Life Unlimited relaunch. · Open →
Q2 2024 Earnings Call — Q2 2024 · 12 pages · The quarter the subsidy shock landed — 149,000 internet losses driven by the end of the Affordable Connectivity Program, and management's framing of what it would cost over time. · Open →
Q4 and Full Year 2023 Earnings Call — FY2023 / Q4 2023 · 12 pages · The original statement of the fixed-wireless and overbuild thesis, with Winfrey taking the blame for missing the subscriber inflection: 'I own that.' · Open →
Q3 2023 Earnings Call — Q3 2023 · 12 pages · The last quarter of internet customer growth, and the clearest early read on subsidized rural economics — roughly 50% penetration twelve months after a rural build. · Open →
Charter Communications, Inc.'s annual reports contain management's most considered account of the business. These are the sections, passages and visual pages worth opening in the originals preserved in Sources.
Charter Communications, Inc. — FY2025 Annual Report (Form 10-K) — FY2025
The current filing: the converged-connectivity strategy, the restated customer metrics, and the two pending deals that reset the balance sheet. · Open the full document →
Item 1. Business. — p. 7 · Read the full section →
Management's definition of the business and of the loop it runs: more products per relationship, fewer service calls, lower churn.
What Charter says it is, and the strategy it says follows from that.
We are a leading broadband connectivity company with services available to 58 million homes and small to large businesses across 41 states through our Spectrum brand. Founded in 1993, we have evolved from providing cable TV to streaming, and from high-speed Internet to a converged broadband, WiFi and mobile experience. […] Our strategy is focused on utilizing our fiber-powered network to deliver high-quality, competitively priced products, with outstanding service, allowing us to increase both the number of customers we serve over our network and the number of products we sell to each customer. This combination also reduces the number of service transactions we perform per relationship, yielding higher customer satisfaction and lower customer churn, which results in lower costs to acquire and serve customers and drives greater profitability.
p. 7 · Read in context →
Corporate Entity Structure — p. 10 · Read the full section →
The debt sits in silos, and which silo matters: the map behind the split credit rating and the covenant discussion later in the filing.
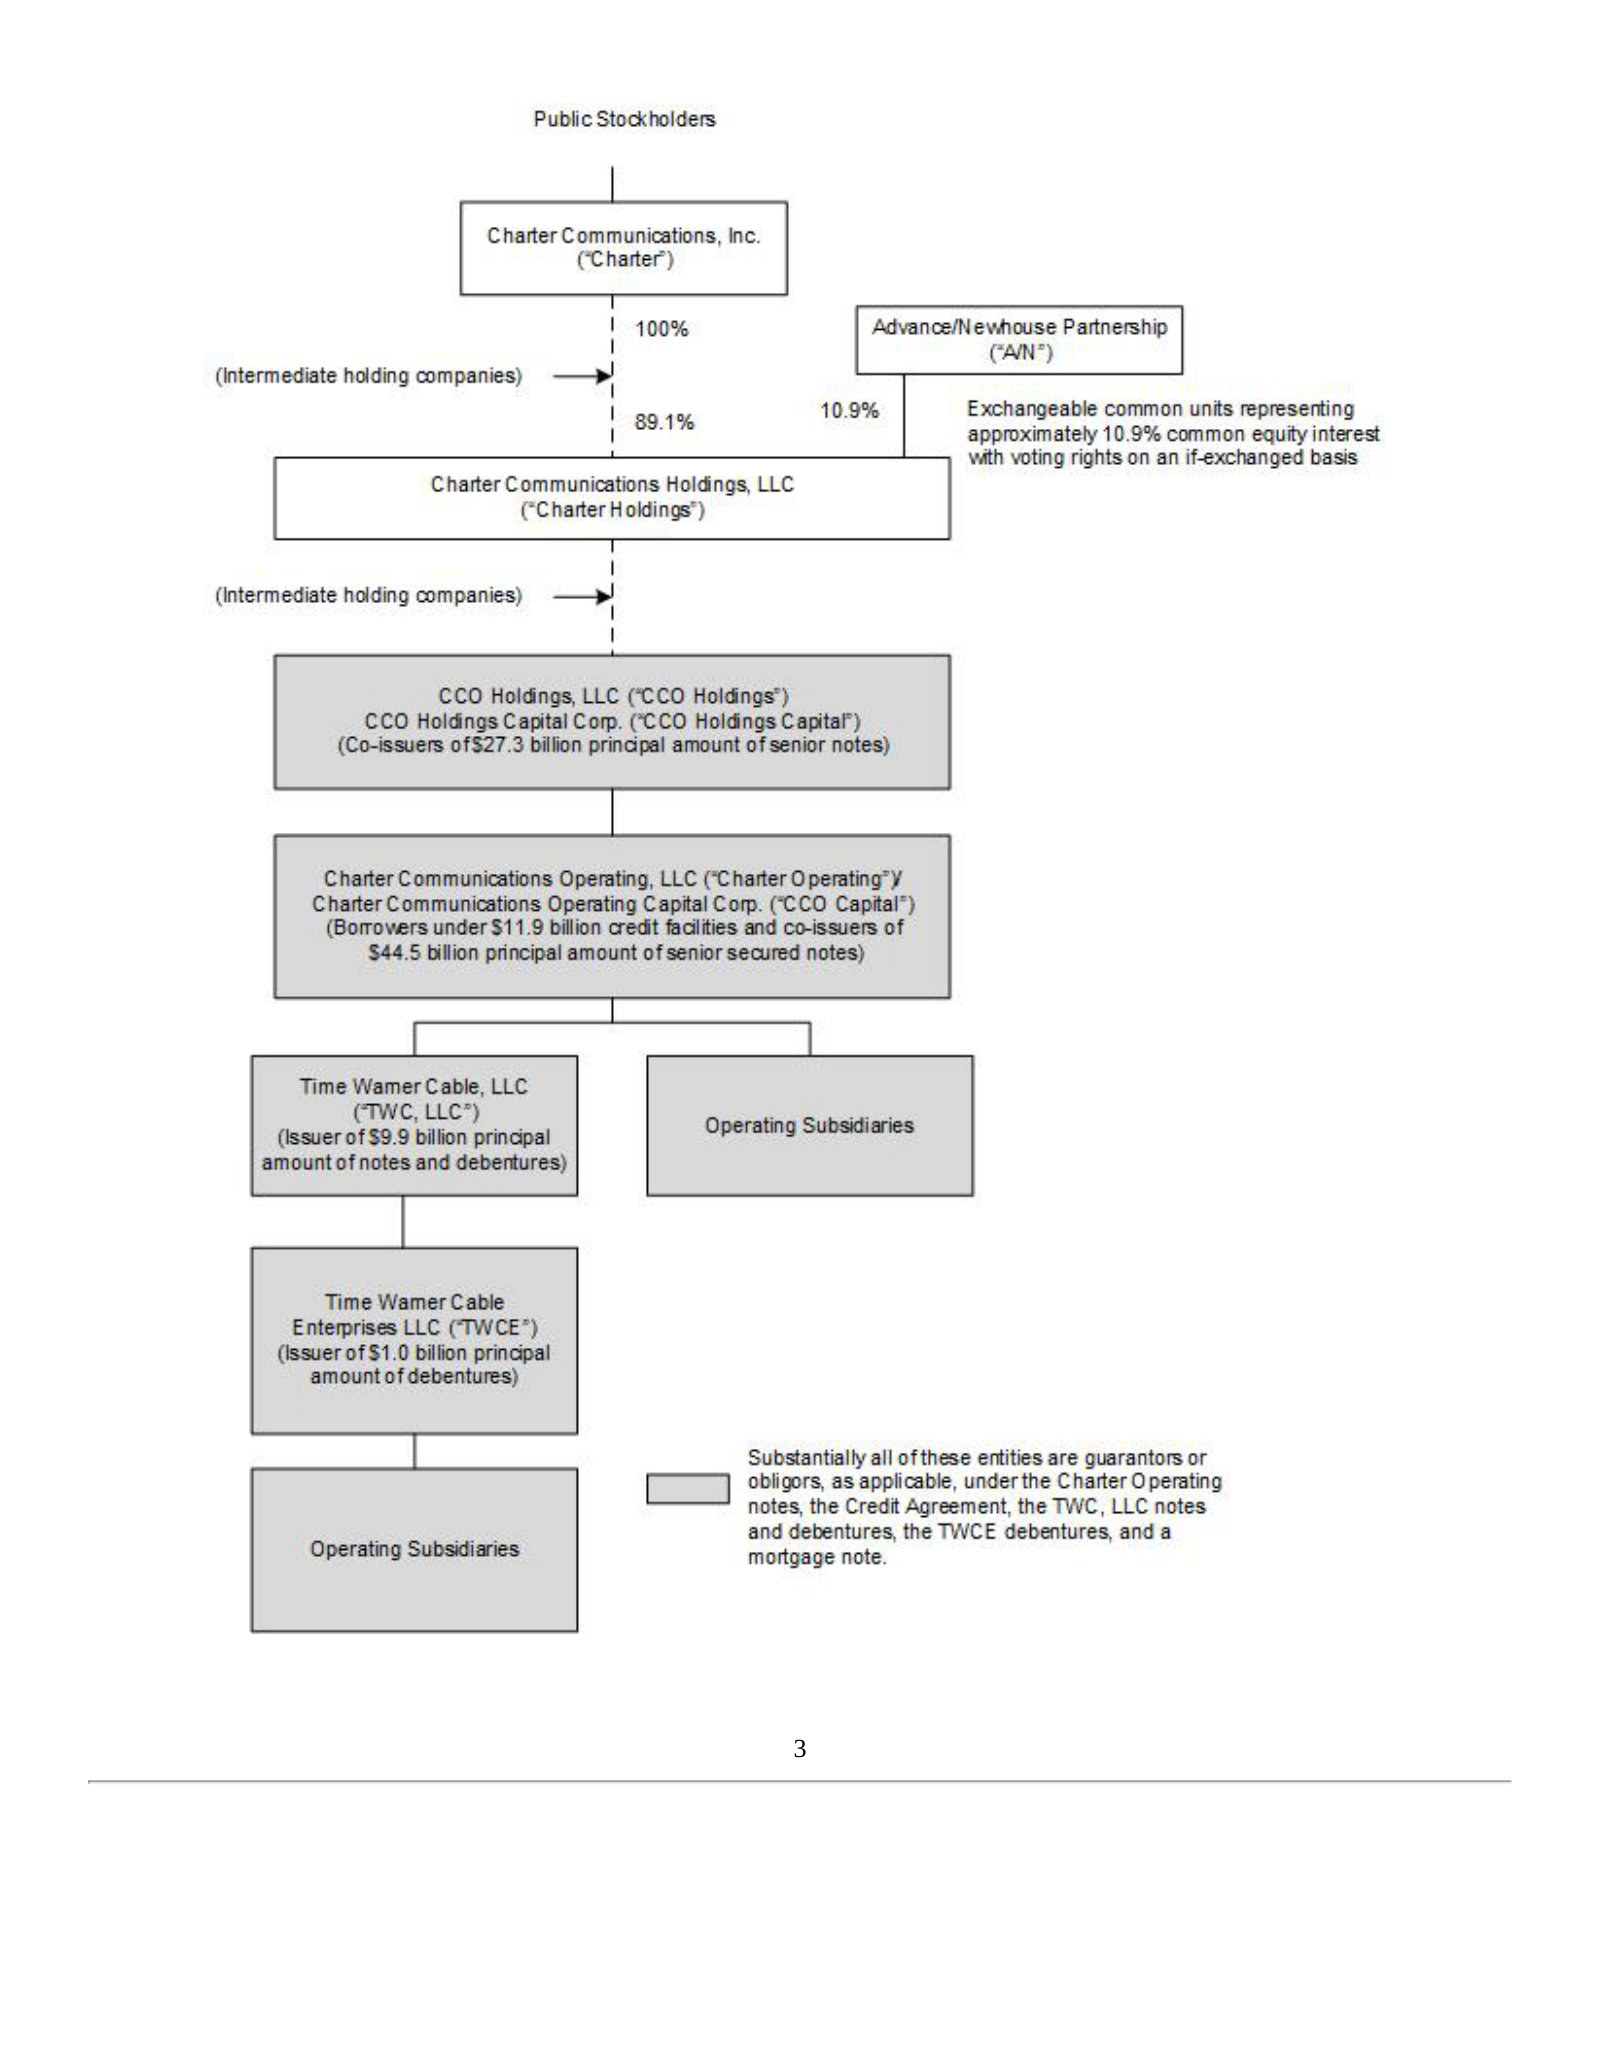
Products and Services — p. 12 · Read the full section →
Charter rewrote its customer-metric definitions in Q4 2025; this table is the base for every per-customer figure the company reports.
The Q4 2025 revision to how customers, connectivity relationships and mobile lines are counted.
We offer our customers subscription-based Internet, mobile, video and voice services, with prices and related charges based on the types of service selected, whether the services are sold as a “bundle” or on an individual basis, and based on the equipment necessary to receive our services. […] To better reflect the converged and integrated nature of our business and operations, in the fourth quarter of 2025, we revised our customer relationship statistics to include all mobile customers, including mobile-only customers, and have added information on total connectivity customers, which represent all customers receiving our Internet and/or mobile connectivity services. In addition, in the fourth quarter of 2025, certain reporting policies related to mobile lines were revised to better align with other Charter services. Other minor changes were made to small business Internet customers and mid-market & large business primary service units (“PSUs”) to standardize reporting methodologies. Prior periods have been revised accordingly.
p. 12 · Read in context →
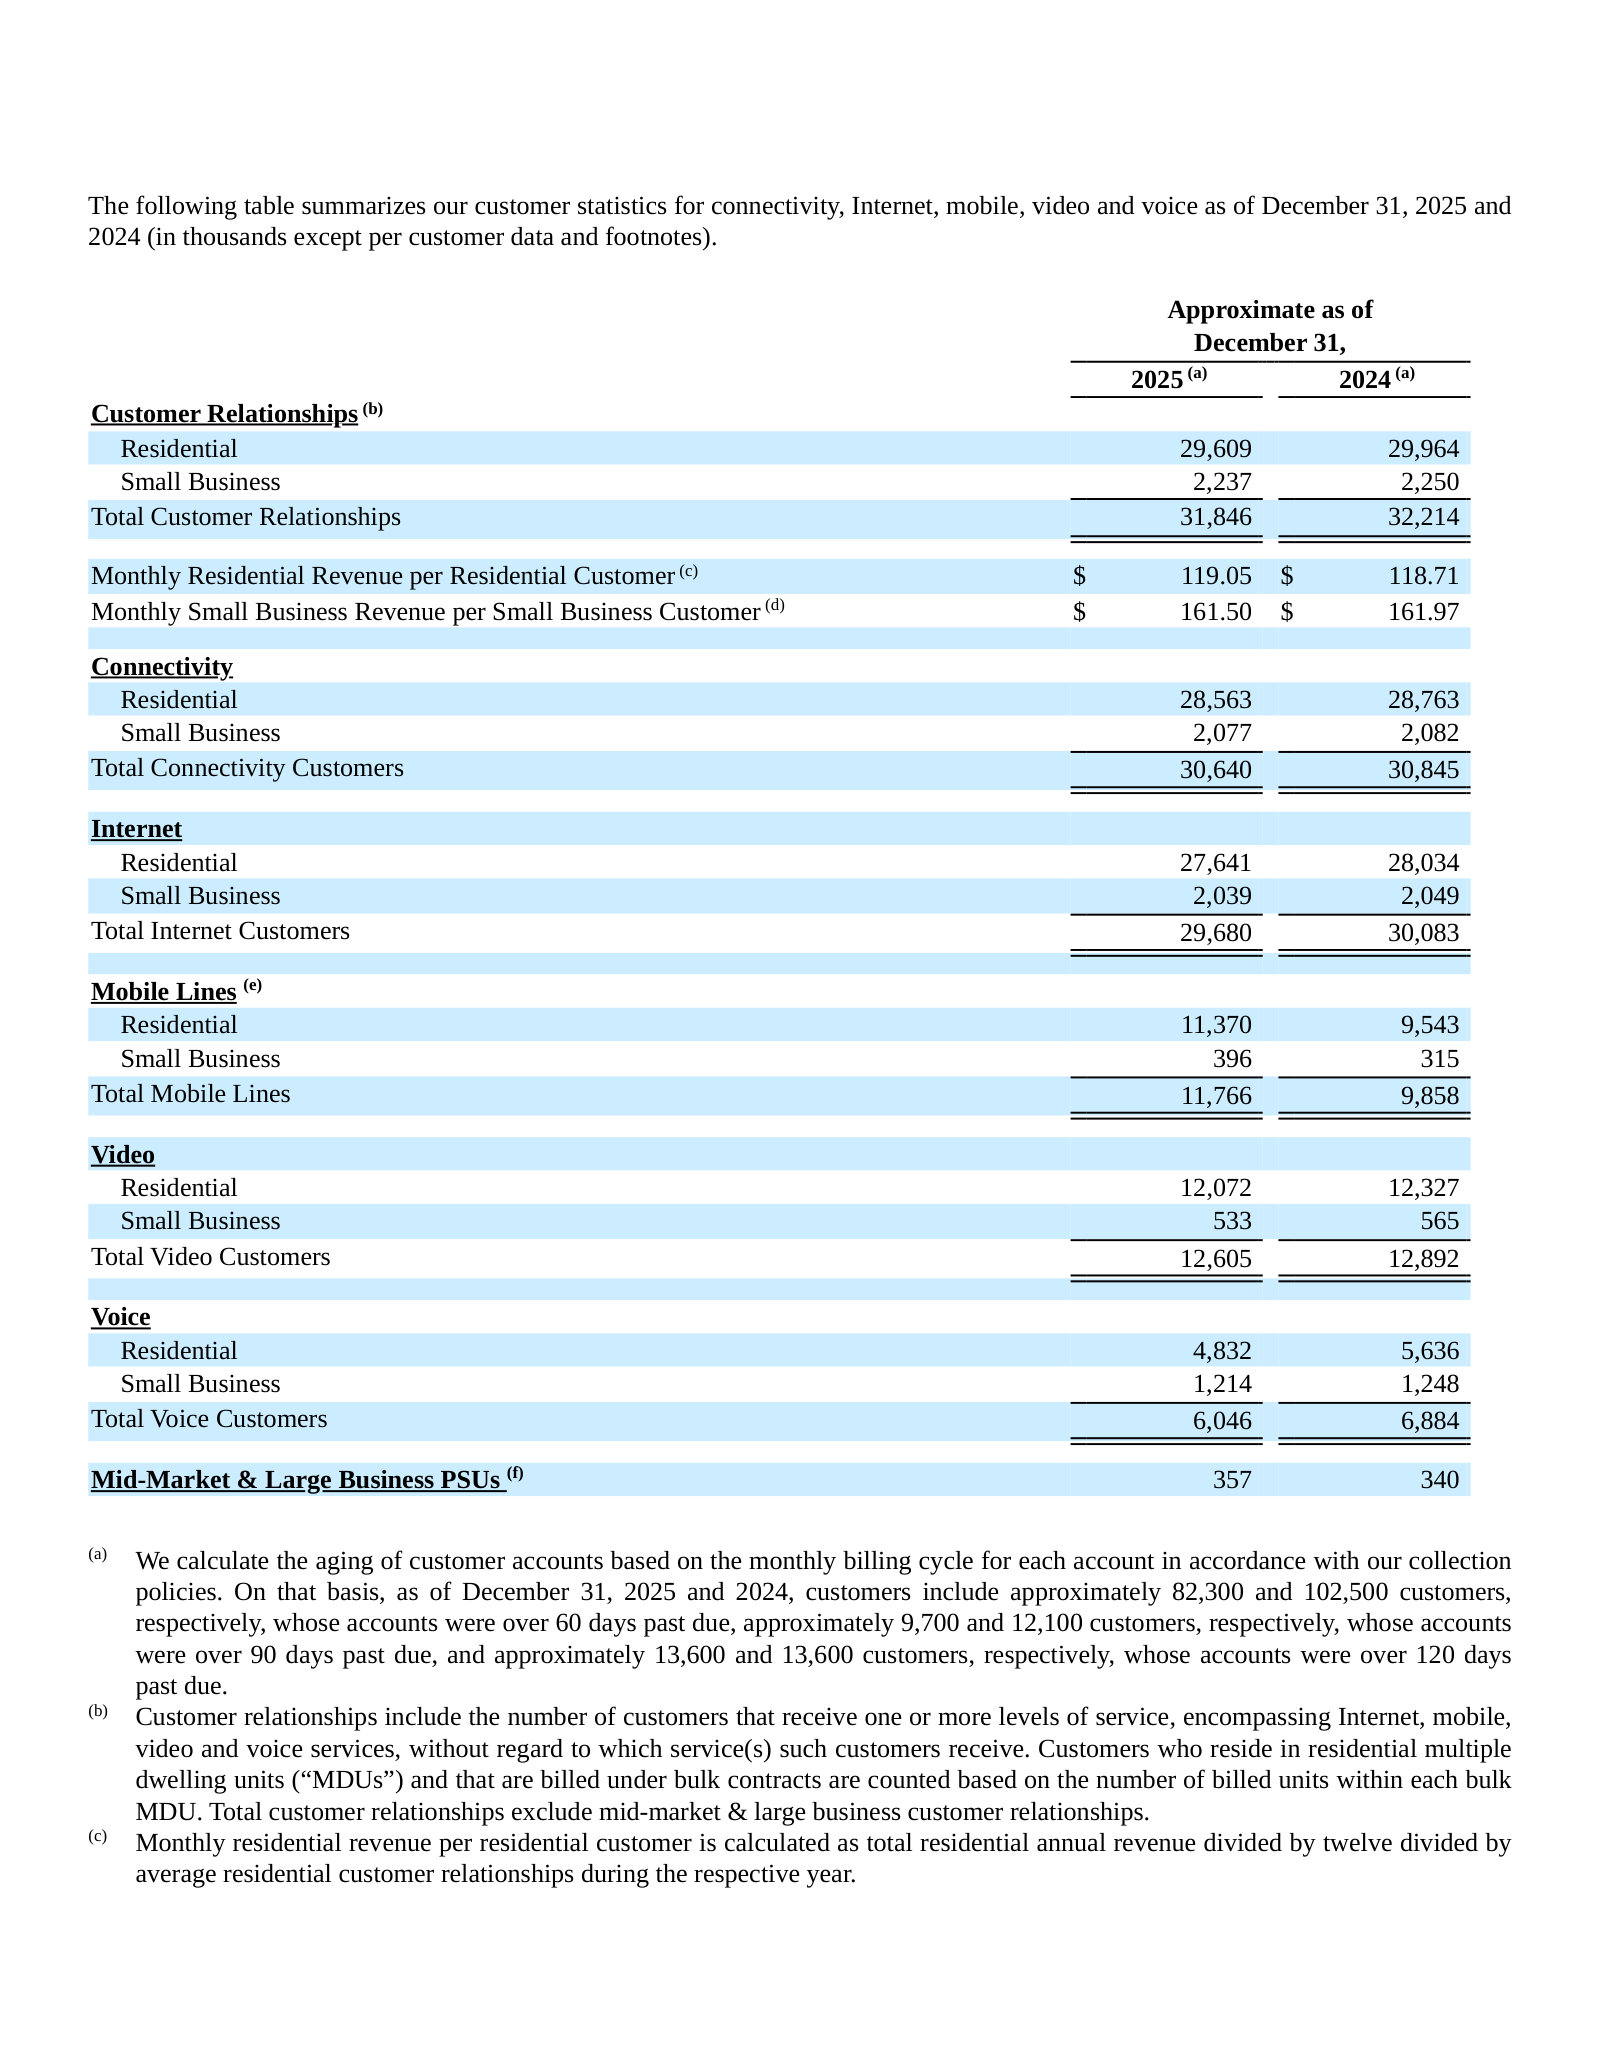
Our Network Technology — p. 23 · Read the full section →
The capital story in plain terms: what the HFC plant is, and what it is being upgraded to over the next several years.
The network evolution path: 1.2 GHz now, then DOCSIS 4.0 and 1.8 GHz, with fiber on demand.
Our last-mile network largely utilizes a hybrid fiber coaxial cable (“HFC”) architecture, which combines the use of fiber optic cable with coaxial cable, together creating our fiber-powered network. […] For most new buildouts, including for our rural construction initiative, and MDU sites, we utilize an all-fiber deployment. We believe that our fiber-powered network design provides high capacity and signal quality with a cost-efficient path to increased speeds. […] Our systems currently provide a two-way all-digital platform, leveraging DOCSIS 3.1 technology and bandwidth of 750 megahertz or greater, to virtually all of our passings not yet part of our network evolution initiative. […] Through our network evolution initiative, we are currently expanding our spectrum to 1.2 GHz through a module upgrade in the hub, node and amplifier and using high splits and DAA to deliver multi-gig speed capabilities while using the current DOCSIS 3.1 customer premise equipment. When paired with the next generation of DOCSIS modem, DOCSIS 4.0, we will be able to deliver even faster speeds. Next, we will begin to deploy DOCSIS 4.0 technology in the network and further increase our spectrum to 1.8 GHz enabling even higher speed capabilities. This network evolution will also allow us to extend fiber services to the home in a success based “Fiber on Demand” manner.
p. 23 · Read in context →
Competition — p. 27 · Read the full section →
Charter puts numbers on the overlap - AT&T and Verizon fiber across 27% and 16% of the footprint - not just adjectives.
The fiber and fixed-wireless overlap on residential Internet, quantified by competitor.
Our residential Internet service faces competition across our footprint from fiber-to-the-home ("FTTH"), fixed wireless broadband, Internet delivered via satellite and DSL services.
Several FTTH competitors deliver 1 Gbps broadband speed (and some deliver multi Gbps) in at least a portion of their footprints which overlap our footprint. AT&T Inc. ("AT&T") and Verizon are our primary FTTH competitors. We face terrestrial broadband Internet (defined by the Federal Communications Commission (“FCC”) as at least 100 Mbps) competition from AT&T and Verizon in approximately 27% and 16% of our operating footprint, respectively. […] Several national mobile network operators offer long-term evolution (“LTE”) or 5G delivered cell phone home Internet service (fixed wireless access from cell phone towers) in our markets.
p. 27 · Read in context →
Cox Transactions — p. 31 · Read the full section →
The larger of the two pending deals and the one that resets ownership and leverage; the structure is set out here in management's words.
The three-part structure of the Cox deal, including the $1.00 paid to Charter.
On May 16, 2025, Charter, Charter Holdings, and Cox Enterprises, Inc. (“Cox Enterprises”) entered into a Transaction Agreement (the “Transaction Agreement”) pursuant to which (i) Cox Enterprises will sell and transfer to Charter 100% of the equity interests of certain subsidiaries of Cox Communications, Inc. (“Cox Communications”) that conduct Cox Communications’ commercial fiber and managed IT and cloud services businesses (the “Equity Sale”), (ii) Cox Enterprises will contribute the equity interests of Cox Communications and certain other assets (other than certain excluded assets) primarily related to Cox Communications’ residential cable business to Charter Holdings (the “Contribution”), and (iii) Cox Enterprises will pay $1.00 to Charter (collectively, the “Cox Transactions”).
p. 31 · Read in context →
Item 1A. Risk Factors. — p. 44 · Read the full section →
Two risks specific and quantified for Charter, not boilerplate: programming-cost pass-through, and the leverage that funds Cox.
Programming costs: why they cannot be fully passed through, and what streaming apps do to the video subscription.
We may not have the ability to pass on to our customers all of the increases in programming costs, which could adversely affect our cash flow and operating margins.
Programming costs are one of our largest expense items. While decreases in video customers combined with a change in the mix of customers choosing lower cost packages have offset total programming cost increases, we expect contractual programming rates per service subscriber to continue to increase in excess of customary inflationary and cost-of-living type increases as a result of annual increases pursuant to our programming contracts and contract renewals with programmers. Although we pass along amounts paid for local broadcast station retransmission consent to the majority of our video customers, the inability to fully pass programming cost increases on to our video customers has had, and is expected in the future to have, an adverse impact on our cash flow and operating margins associated with the video product. […] Further, some programmers have begun to simulcast and/or move popular programming to programmer streaming applications which has created a competitive alternative to our video subscription at lower price points that could, in turn, result in customer losses.
p. 50 · Read in context →
$94.6bn of principal at 4.15x Adjusted EBITDA, before $4.0bn of cash consideration and $12.6bn of assumed Cox debt.
We have a significant amount of debt, with total principal amount of approximately $94.6 billion and a leverage ratio of 4.15 times Adjusted EBITDA as of December 31, 2025. We expect to (subject to applicable restrictions in our debt instruments) incur additional debt in the future as Charter plans to maintain leverage near the midpoint of its stated 4.0 to 4.5 times Adjusted EBITDA target leverage range (net debt divided by the last twelve months Adjusted EBITDA) in the period leading up to the Closing. As part of the Cox Transactions, Charter will fund the $4.0 billion of cash consideration using debt and will assume Cox Communications' approximately $12.6 billion of net debt and finance leases. Charter plans to adjust its long-term target leverage range after Closing to 3.5 to 3.75 times Adjusted EBITDA but will still have a significant amount of debt.
p. 52 · Read in context →
Item 7. Management’s Discussion and Analysis of Financial Condition and Results of Operations. — p. 80 · Read the full section →
Management on what actually moved 2025: 1.9m mobile lines added against total revenue down 0.6%, with the revenue bridge by product line.
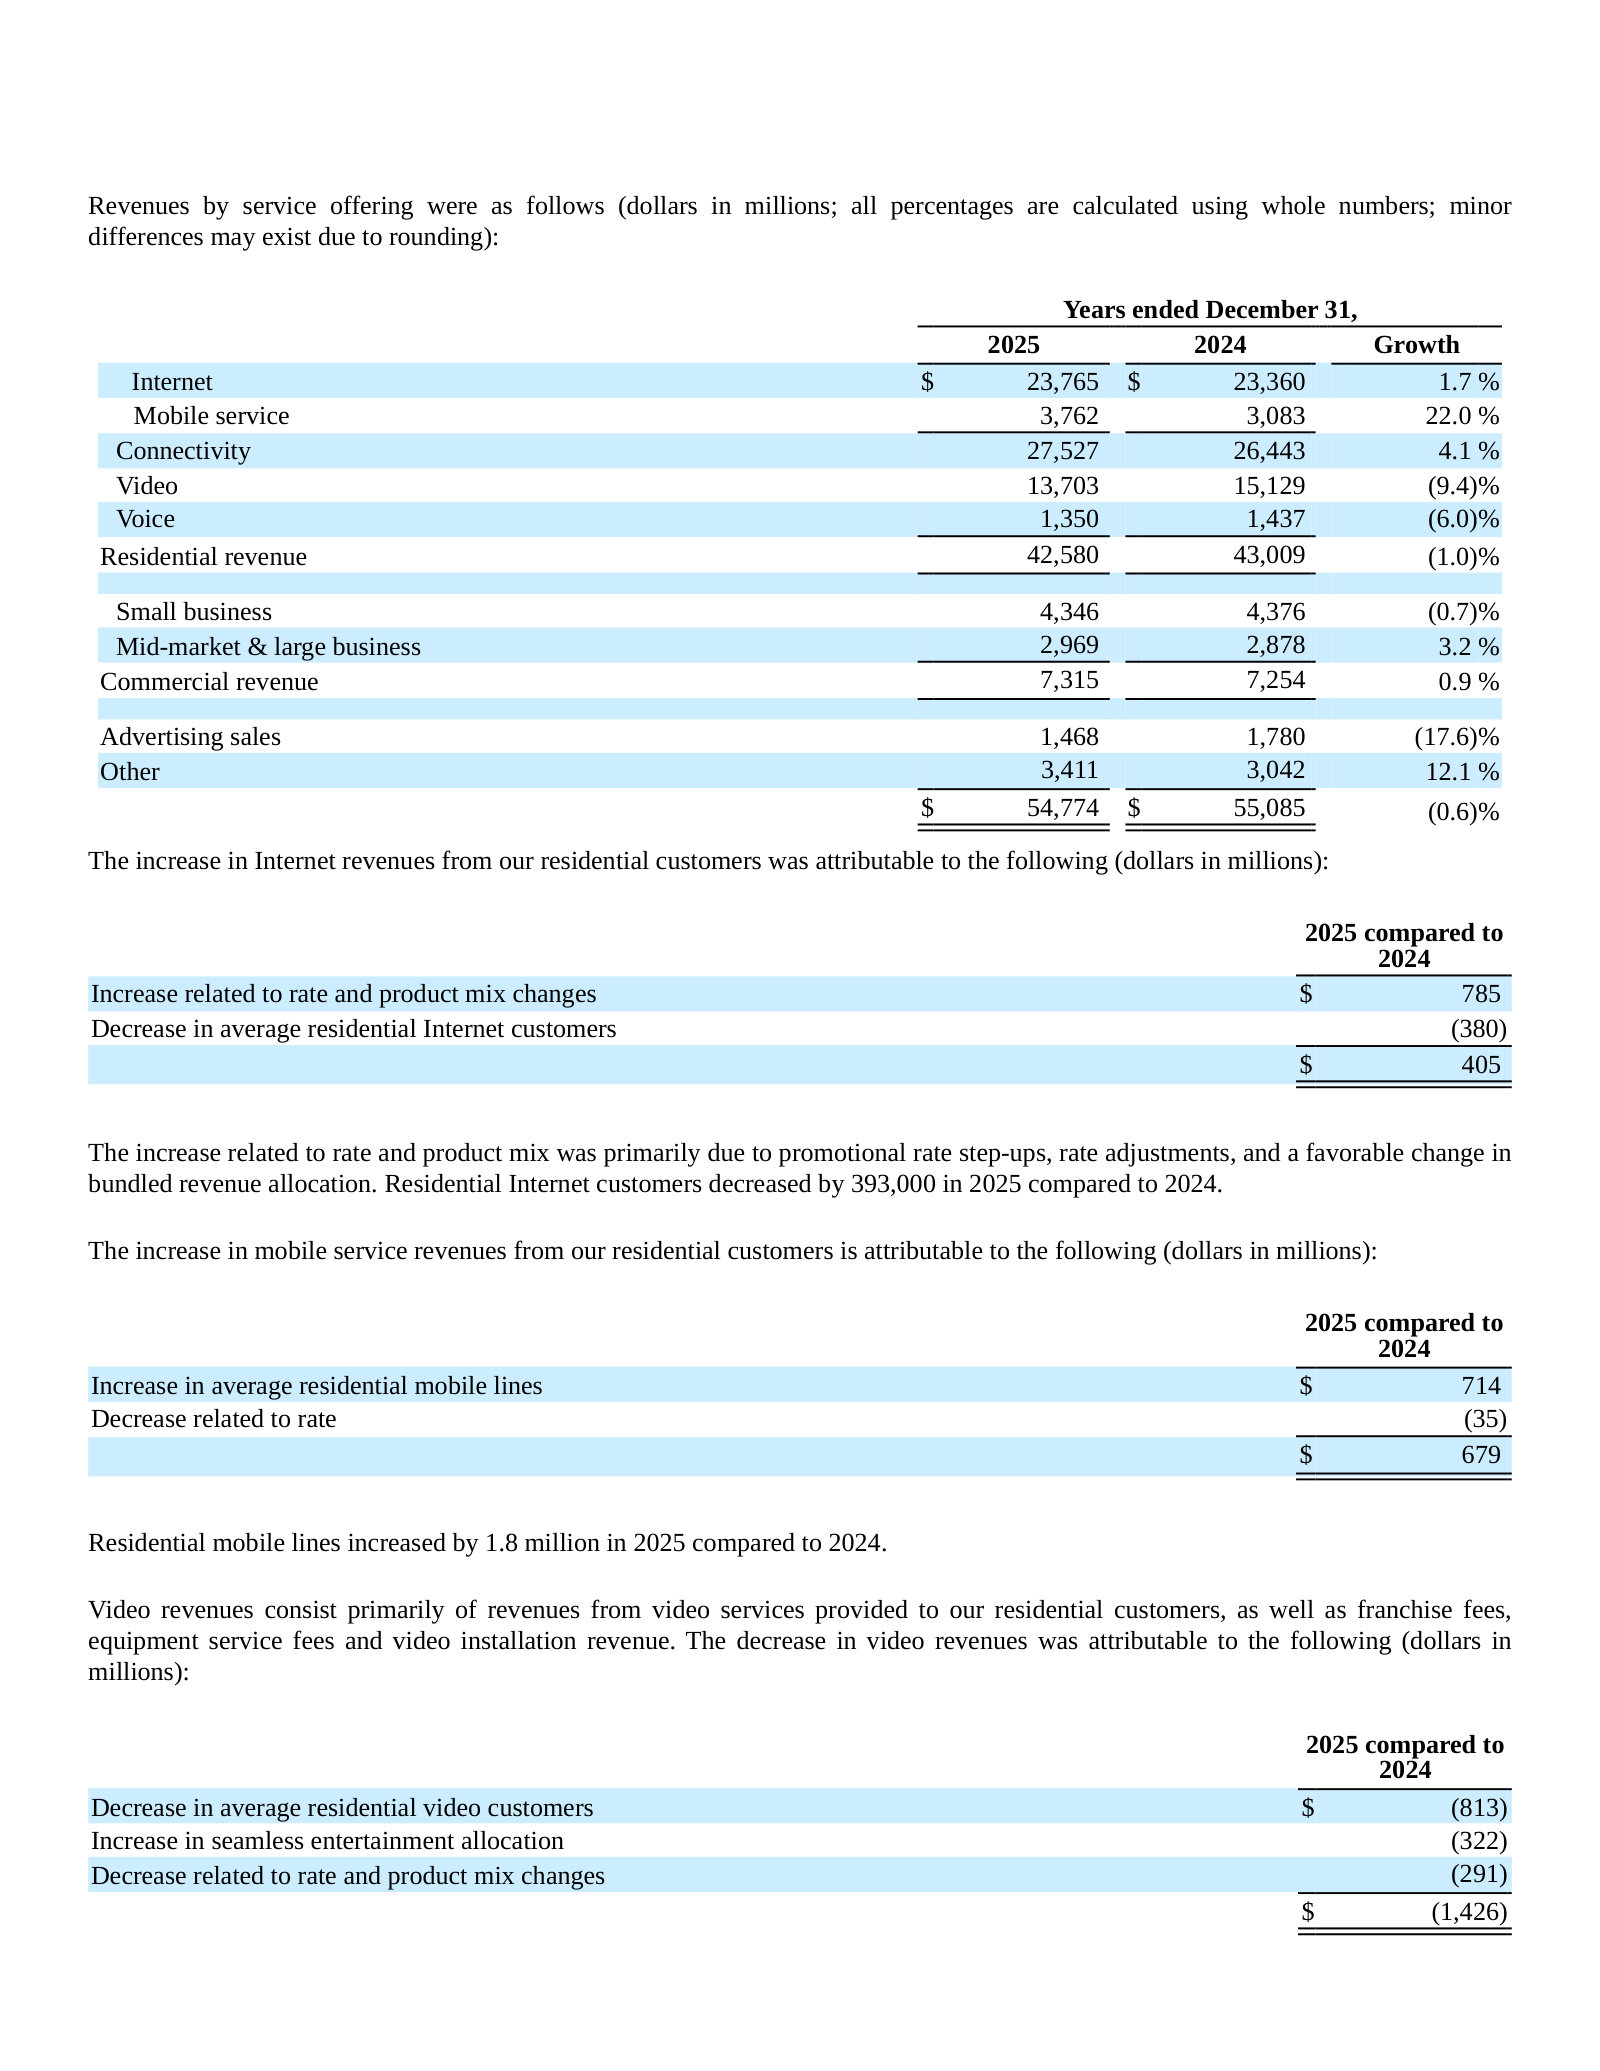
Valuation and impairment of franchises and goodwill — p. 84 · Read the full section →
$67.5bn of franchise rights - 44% of total assets - carried as indefinite-lived and never amortized; the policy defines the balance sheet.
Why franchise rights get indefinite-life treatment, and the headroom in the October 2025 impairment test.
The carrying value of franchise intangibles as of both December 31, 2025 and 2024 was approximately $67.5 billion (representing 44% and 45% of total assets, respectively), and the carrying value of goodwill as of both December 31, 2025 and 2024 was approximately $29.7 billion (representing 19% and 20% of total assets, respectively). […] Management estimates the fair value of franchise rights at the date of acquisition and determines if the franchise has a finite life or an indefinite life. We have concluded that all of our franchises qualify for indefinite life treatment given that there are no legal, regulatory, contractual, competitive, economic or other factors which limit the period over which these rights will contribute to our cash flows. […] Based on our quantitative analysis, we concluded that the fair value of the franchises in each unit of accounting exceeds the carrying value of such assets by more than 10%.
p. 84 · Read in context →
Charter Communications, Inc. — FY2021 Annual Report (Form 10-K) — FY2021
The pre-reset baseline: a cable operator on a fully deployed HFC network, before the rural build, the fiber-powered framing and the mobile scale-up. · Open the full document →
Item 1. Business. — p. 6 · Read the full section →
The same opening paragraph four years earlier: "cable operator", 32 million customers, 54 million passings, no converged framing.
The FY2021 self-description and core strategy, before the converged-connectivity language.
We are a leading broadband connectivity company and cable operator serving more than 32 million customers in 41 states through our Spectrum brand. […] Our network, which we own and operate, passes over 54 million households and small and medium businesses ("SMBs") across the United States. Our core strategy is to use our network to deliver high quality products at competitive prices, combined with outstanding customer service. This strategy, combined with simple, easy to understand pricing and packaging, is central to our goal of growing our customer base while selling more of our core connectivity services, which include both fixed and mobile Internet, video and voice services, to each customer.
p. 6 · Read in context →
More annual reports
Charter Communications, Inc. — FY2024 Annual Report (Form 10-K) — FY2024 · 183 pages · The last filing on the pre-revision customer definitions, and the first to carry the Liberty Broadband merger agreement. · Open →
Charter Communications, Inc. — FY2023 Annual Report (Form 10-K) — FY2023 · 174 pages · Programming cost down to $10.6bn from $11.6bn, and the filing that flags ACP funding running out in April 2024. · Open →
Charter Communications, Inc. — FY2022 Annual Report (Form 10-K) — FY2022 · 165 pages · The first full year of the subsidized rural construction initiative, and the year Spectrum One launched the converged bundle. · Open →
Competitors describe Charter Communications, Inc.'s market in their own filings and calls. These verified passages and visual pages show where their strategies meet, using source documents preserved in Sources.
Comcast Corporation (CMCSA)
Comcast runs the same machine as Charter and nothing else in the peer set does: hybrid fibre-coax passing tens of millions of homes, a broadband base being attacked simultaneously by fibre overbuild and fixed wireless, a wholesale-hosted mobile product used to defend it, and a declining video business. It discloses broadband net adds, broadband ARPU, wireless lines and wireless penetration on the same cadence as Charter, so its quarter-by-quarter numbers are the cleanest available read-across. Only the Connectivity & Platforms discussion is used here; NBCUniversal, Peacock, Sky and the theme parks are out of scope.
Comcast's stated view of where the US broadband market settles: most addresses eventually served by two multi-gig symmetrical providers, with fixed wireless holding the price-sensitive, moderate-need tail. Two concessions inside it matter for Charter — Comcast says it expects most of its own footprint will eventually be overbuilt, and that it does not expect the competitive environment to ease. The 800 GB monthly usage figure is the load argument both cable operators use against capacity-constrained alternatives. This is a forward view from an interested party, and 'winner' status in the implied duopoly is asserted, not demonstrated.
Michael Cavanagh, Co-CEO, prepared remarks (Q3 2025 earnings call): So starting with convergence, the broadband environment remains intensely competitive, which we do not expect to change anytime soon. Over time, though, we believe that the vast majority of the broadband market will be comprised of 2 multi-gig symmetrical providers serving most addresses, and we aim to be a winner in this segment, with the rest of the market likely being served by capacity-limited alternatives. We've been seeing this end state begin to take shape. Fiber expansion continues at a steady pace. And as we've said before, we expect most of our footprint will eventually be overbuilt. At the same time, fixed wireless remains a durable competitor, serving price-sensitive segments with moderate performance needs. […] We're seeing this on our network, where broadband-only customers averaged 800 gigs a month in the third quarter, up 9% year-over-year.
p. 1 · Read in context →
The scoreboard Comcast has chosen to be judged on, and the one Charter's own disclosure now sits beside. Note what is being traded: broadband subscriber losses narrowed by 117,000 year-over-year and wireless lines hit a record 435,000, closing at 9.7 million lines and 16% penetration of the residential broadband base — but broadband ARPU fell 3.1% and the free-line offer is explicitly dilutive to it, with nearly half of residential postpaid phone connects taking a free line. The ~$85 convergence ARPA against 'roughly double' for the telcos is Comcast's framing of headroom; read the other way it is a measure of how much less a converged cable relationship monetises today. Comcast defines and computes the ARPA metric itself, and the competitor comparison is unsourced.
Jason Armstrong, CFO, prepared remarks (Q1 2026 earnings call): Our convergence ARPA, or average revenue per account, currently stands at roughly $85. For context, our telecom competitors are roughly double this amount on the same metric. This really underscores the significant growth opportunity in front of us, especially as we stabilize broadband and look to accelerate growth through wireless. […] Broadband subscriber losses improved by 117,000 year-over-year to 65,000. This improvement reflects traction from our new go-to-market strategy, including improved connects year-over-year, lower voluntary churn, a step-up in take rates on gig-plus speeds and the continued uptake of our free wireless line offer. […] Broadband ARPU declined 3.1%. This is consistent with the pressure we signaled on our fourth quarter call, and reflects the absence of a rate increase at the beginning of the year, our new go-to-market pricing, including the Legendary February offers and the impact from strong adoption of free wireless lines, which initially has a dilutive impact on broadband ARPU. […] We added 435,000 net wireless lines, our strongest quarter on record with nearly half of our residential postpaid phone connects coming from customers taking a free line. We're deliberately leaning in as our free line offer expands awareness and ultimately widens the base of customers we can drive into paying relationships. We also continue to see a strong uptake in our new premium unlimited wireless plans, accounting for about 30% of our postpaid phone connects reinforcing that we're competing effectively in the higher-value segment of the wireless market. We ended the quarter with 9.7 million total lines at 16% penetration of our domestic residential broadband customer base.
p. 3 · Read in context →
The cable-mobile economics argument stated by Comcast in its own words: two MVNOs, the largest converged footprint, WiFi offload of roughly 90% of Xfinity Mobile traffic, and lower acquisition cost because the product is sold into an existing broadband base. About 30% of connects come from existing mobile customers adding lines. This is the same case Charter makes for Spectrum Mobile, which makes it a useful independent statement of the model's logic; it is also a competitor describing its own product, and the offload and cost-structure figures are unaudited management estimates. The T-Mobile business MVNO referenced is the agreement Comcast struck jointly with Charter.
Steven Croney, President, Connectivity & Platforms, in Q&A with Michael Rollins, Citigroup (Q1 2026 earnings call): I strongly believe we have the right to compete and win when it comes to mobile. We have two strong MVNOs covering consumer and broadband. We have the largest converged footprint. We have the nation's largest WiFi network. We've talked about it. We offload about 90% of Xfinity Mobile traffic, and we have lower acquisition costs because we're selling to our base. […] About 30% of our connects are coming from existing mobile customers adding more mobile lines, which is really important for us. […] And then on top of that, we have the T-Mobile MVNO, which will be launched in the near future, bringing mobile availability to our mid-market and enterprise customer base.
p. 7 · Read in context →
T-Mobile US, Inc. (TMUS)
T-Mobile is the largest single source of broadband share loss for cable and it says so openly: fixed wireless access built on spare capacity, now paired with fibre joint ventures. Its 10-K names Charter directly as a competitor, both in wireless and as an MVNO. It is also the counterparty on the business-mobile MVNO Charter and Comcast signed in 2025, so it sits on both sides of Charter's convergence strategy. Only the consumer wireless and broadband discussion is used here.
The sharpest articulation available of how T-Mobile positions itself against cable: the incumbent is framed as under-invested and over-priced, and fixed wireless is described not as a stopgap but as a durable category riding 'fallow capacity' on the wireless network. Charter is one of the incumbents this targets. The premium and under-investment claims are T-Mobile's characterisation of rivals it is selling against, not a measured comparison, and the fallow-capacity model is bounded by wireless peak-hour demand.
Srinivasan Gopalan, COO and incoming CEO, in Q&A with John Hodulik, UBS (Q3 2025 earnings call): We're really excited by the broadband opportunity. This plays to the heart of the Un-carrier, because what we've got here is customers in a place where they have an inferior product quite often, where they're paying a huge premium. It's classic Un-carrier territory, going in and attacking incumbents who have not invested in their networks and who are charging a large premium for a product that isn't living up to expectations. Now we'll go after that with both FWA as well as fiber. We see those as complementary. And the way we think about both those businesses is setting them up in a way that the economics allow us to pursue the Un-carrier strategy. What I love about FWA is the heart of it is the fallow capacity model. And what we're benefiting from is the ultra capacity network, but also the rapid evolution you're seeing in mobile technology, which is moving far quicker than a lot of other technologies, which is giving us more and more runway and also making the product incredibly sustainable. We see FWA as not a temporary category, but something that's here to stay as mobile technology gets better and better and taps into a customer need, which a lot of people trapped in old relationships with incumbents are suffering from.
p. 4 · Read in context →
T-Mobile's stated broadband target: 15 million fixed wireless customers by 2030 plus 3–4 million on fibre, for 18–19 million total. For a cable operator the load-bearing sentence is that all of it is incremental to T-Mobile — every one of those relationships has to be taken from an existing wireline provider. The second passage is management's claim that its wireless share holds up even where rivals build fibre; Gopalan himself disclaims causality. These are multi-year targets from an interested party, not results.
Srini Gopalan, CEO, prepared remarks (Q4 2025 earnings call and Capital Markets Day update): Moving on to broadband. Now our broadband business for the most, our FWA product is based on this ultra-capacity network. And a lot of you have asked us, so you know, where does FWA go? How do you think of capacity in this context? We've said 12 million customers in 2028. Today, I'm delighted to tell you that we believe this business will go to 15 million customers in 2030, and that there's a lot of runway even beyond that. Fiber, we believe, will add three to 4 million customers. Which will give us a broadband business of 18 to 19 million customers by 2030. I'd like to pause for a minute. We would have built a business with 18 to 19 million customers in seven years. Not sure is any company of our size and scale that's done that. 18 to 19 million customers in this industry in broadband, and remember for us, this is all incremental. None of this is an overbuild of copper and cannibalization. All of this is incremental revenue. It's incremental customer relationships that we can nurture. […] An interesting fact is in areas where our competitors have built fiber, we have gained share. Now I'm not suggesting that there's any causality there. Right? But we have gained share even in areas where our competitors have built fiber
p. 6 · Read in context →
Asked directly about buying cable, T-Mobile's CEO rules it out and restates the strategy as attacking incumbents rather than becoming one. Two things follow for Charter: the most frequently cited strategic bid for US cable assets is being publicly withdrawn, and the alternative T-Mobile names is continued organic attack on cable's broadband base through both fixed wireless and fibre. Statements about M&A intent are not commitments and can change.
Srinivasan Gopalan, President and CEO, in Q&A with Kannan Venkateshwar, Barclays (Q1 2026 earnings call): Kannan, it just struck me that your reference to large deals potentially was you asking the question I get asked quite often, which is the cable story. As I've said before, we're not going to go do scale for scale's sake. Specifically, cable is not something we're interested in. We see our strength as attacking incumbents rather than becoming an incumbent. We see a huge opportunity to attack incumbents across fiber and fixed wireless access. That will be our key play.
p. 8 · Read in context →
Verizon Communications Inc. (VZ)
Verizon is simultaneously Charter's largest wholesale mobile supplier and one of its two biggest broadband attackers. Its consumer MVNO hosts Spectrum Mobile; its Fios and newly-acquired Frontier fibre overbuild Charter passings; its fixed wireless product competes for the same value-end household. The December 2025 renewal of the Comcast/Charter MVNO and the Frontier close both land inside the window covered here. Business/enterprise and Verizon Media discussion is out of scope.
Verizon on both halves of its relationship with Charter in one passage. On the attack side: Frontier closed, over 30 million fibre passings today, at least 2 million more this year and a stated medium-term goal of 40–50 million — a build path that runs through Charter footprint. On the supply side: the long-term MVNO with Comcast and Charter is renewed, which Verizon calls accretive to itself. Terms were not disclosed by either party, so the economics of the renewal for Charter cannot be read from this. The passings goal is a target, not a commitment.
Daniel Schulman, CEO, prepared remarks (Q4 2025 earnings call): First, and obviously crucial to our converged future is the closing of our Frontier acquisition. We now have over 30 million fiber passings with a huge cross-sell opportunity as we are significantly underpenetrated with our wireless services in Frontier markets. I want to thank the entire Frontier team for their focus and execution over the past 18 months. We intend to continue our fiber build-out, adding at least 2 million fiber passings this year, with our goal to reach 40 million to 50 million fiber passings over the medium term. […] The combination of our assets creates a powerful force in the market, and we intend to aggressively seize incremental net adds and share of both mobility and broadband services within Frontier markets. I'm also very pleased to announce that we have completed a comprehensive long-term agreement with Comcast and Charter to continue our partnership. We obviously can't reveal any of the details, but each of us agrees the partnership is on very solid footing financially, operationally, and strategically. It is an accretive deal that ensures their customers remain on the best network.
p. 2 · Read in context →
The quarterly broadband share-take that shows up on the other side of cable's losses: 372,000 net adds in Q4 2025, of which 319,000 fixed wireless and 67,000 Fios, with Frontier adding a further 125,000 fibre lines on a footprint that grew by roughly 1.3 million passings during the year. The 16.3 million connections figure combines fibre and fixed wireless, which are very different products economically; the aggregate flatters the fibre business and is Verizon's chosen presentation.
Anthony Skiadas, CFO, prepared remarks (Q4 2025 earnings call): Moving to broadband, we also continued to take meaningful share. Fourth quarter net adds were 372,000, our highest of the year, reflecting strong customer demand across both fixed wireless access and fiber. Fixed wireless access net adds were 319,000. The quarter-over-quarter improvement was driven by our consumer segment and reflects the innovation and expansion around the product offering. Fios Internet delivered 67,000 net adds, our highest fourth quarter net additions since 2020. […] Frontier delivered an exceptional performance in the fourth quarter, generating 125,000 fiber net additions, representing a 29% increase over the prior year. This momentum was supported by strong operational pace. Frontier deployed approximately 1.3 million new fiber passings in 2025, bringing their footprint to more than 9 million fiber passings. We are incredibly pleased to have Frontier in our portfolio, and we're excited about the long-term growth potential these assets provide. When we combine Frontier, FWA, and fiber, net adds were almost 1.9 million for 2025, resulting in over 16.3 million connections.
p. 3 · Read in context →
Verizon's convergence maths, stated by its CEO: churn roughly 30% lower on converged accounts, higher lifetime value and ARPA, and a claimed 55% wireless attach where the customer already takes broadband. Charter runs the mirror image of this trade — selling mobile into a broadband base rather than broadband into a wireless base — so the attach-rate and churn figures are the most directly comparable numbers a competitor publishes. The 'best in the industry' claim is Verizon's own and is not independently sourced, and the mix shift toward fibre and away from fixed wireless is a stated intention rather than a result.
Daniel Schulman, CEO, in Q&A with John Hodulik, UBS (Q1 2026 earnings call): So convergence is obviously one of our key vectors of growth. We intend to fully leverage our growing fiber footprint. As I mentioned in the last earnings call, we are still very focused on driving our fiber footprint to 40 million to 50 million passings over the medium term. We made good progress this quarter towards that and expanding our fixed wireless access capacity. In Q1, we continue to take broadband share. We have absolutely no intention to slow down; in fact, quite the opposite. We have a huge cross-sell opportunity. Only 20% of our base has broadband. And so we see a large go-to-market opportunity for us there. Look, fiber has inherent advantages over FWA, and we're going to prioritize it where we have coverage. And therefore, you should expect a mix shift from where we've previously been. We have very positive economics on both our broadband and our wireless when converged; churn is almost 30% less on converged offers and they have both higher LTV and ARPA. […] There's no question we think that fiber is a key differentiator against competitors who don't have it. And I'd also point out that our attachment rate of wireless when a customer has broadband is, I think, best in the industry at 55% right now.
p. 9 · Read in context →
AT&T Inc. (T)
AT&T is the largest fibre overbuilder in the country and the most explicit about pricing against cable. It is moving from 32 million to a stated 40 million fibre locations during 2026 and roughly 5 million a year after, and it pairs that with Internet Air fixed wireless in the copper areas it is retiring. Management discusses Charter and Comcast pricing directly on the record. Media and the divested WarnerMedia assets are out of scope.
The most direct on-the-record characterisation of Charter's competitive position by a competitor's CEO, given in answer to a question that named Charter. Stankey's claim is structural rather than tactical: AT&T says it prices beneath a cable 'pricing umbrella' with what it considers a better product, so cable is the party that has to reprice. The footprint numbers behind it are checkable — 32 million fibre passings at end-2025 to 40 million during 2026, then roughly 5 million a year. The product-inferiority judgement is an assertion by a rival, and 'sitting under the pricing umbrella' also concedes that AT&T's realised ARPU is the lower of the two.
John Stankey, CEO, answering Peter Supino, Wolfe Research, who asked about Comcast and Charter broadband pricing (Q4 2025 earnings call): Look, I've said it before, I think we're in a distinctly different place in cable. One is we currently sit under their pricing umbrella. We're not at their levels. So we have a lot more degrees of freedom in how we manage our ARPUs and our various offers in the market than they have. So it's one thing, understand why they're having to make the changes they're making; they're priced higher and their products are inferior. And so they're the ones that are having to readjust to the market, not us. We've got the better product, we're priced lower. And that's why this is a problem for them. And as a result of that, I think we've got all the actions we need when you think about the fact that we have owners' economics on both our products we can play with the value across and we don't have to run one product to zero to make the other one worthwhile to somebody. I just think we're in a great place for us to be able to manage our value to the customer and what we bring out to them. And when you're doing it on the foundation of a better product, that's a good thing. I made the point I made in my comments for a reason. How do we continue to win and grow and share? We continue to grow our footprint. 32,000,000 fiber passings at the end of 2025, 40,000,000 at the end of this year. That's a growth rate that we've never had. And it's going to be five million a year thereafter.
p. 9 · Read in context →
AT&T quantifying what convergence is worth to it: a fibre convergence rate of 42%, up 200 basis points year-over-year, and an estimated 10-point higher postpaid phone share in fibre areas than non-fibre areas. The Lumen passage is the forward risk for cable — a fibre network at 25% penetration and under 20% wireless attach that AT&T intends to run at its own 40%-plus penetration, which implies a sustained share campaign in those geographies. The 10-point share estimate is AT&T's own calculation, disclosed without method, and the Lumen penetration uplift is a plan rather than an outcome.
John Stankey, CEO, prepared remarks (Q4 2025 earnings call): Our convergence strategy is a winning play both structurally and in the market. During the fourth quarter, we once again saw acceleration in the portion of AT&T Inc. Fiber customers that also have our wireless services. Our fiber convergence rate climbed 200 basis points year over year to 42%, which is our fastest annual increase since we began tracking this metric. This is further evidence that where we have fiber, we win with fiber and 5G. The impact of this success on our wireless business is material. We estimate that our share of postpaid phone subscribers is 10 percentage points higher in areas where we offer fiber than in areas where we don't. […] Scores for our converged offers are not simply better than our standalone services; they're improving in most categories. So it's no surprise that our converged customers remain our most valuable with lower churn and a propensity to take higher internet speeds, attach more wireless lines, and stay with us longer. Our acquisition of Lumen Fiber assets, which we expect to close in short order, is a key example of how we've positioned AT&T Inc. to materially improve share in home internet and wireless. We're acquiring a fiber network with only 25% customer penetration, well below AT&T Inc. fiber penetration of 40%. We estimate that fewer than 20% of these customers also subscribe to our wireless services. This is less than half of the convergence rate we've achieved in our current fiber footprint.
p. 1 · Read in context →
Where AT&T says the next round of the broadband fight happens. Getting a fibre market from 0% to 40% penetration is described as a solved, high-return exercise; getting from 40% to 50% requires a different play aimed at the value-conscious, price-sensitive segment, and AT&T says it is prepared to accept ARPU dilution to win it. That segment overlaps directly with the base Charter defends on price. This is a statement of intent about future pricing behaviour, not a disclosed plan with numbers attached.
John Stankey, Chairman and CEO, in Q&A with Peter Supino, Wolfe Research (Q1 2026 earnings call): And then finally, I'll say this also lines up with the reality of where the broadband market is, in my view, which is getting from 0% to 40% penetration as we build fiber is really important. That's a really good return when we do that, and we're doing that incredibly well, and very effectively; that hasn't changed as we've opened up new footprint, accelerated our build. We see our drive to 40% as being really good, really strong. We continue to even refine it, get a little bit better. Although I'm pretty impressed, I've shared with you before that we're probably a year faster than what we expected we would be in the original business case, and that helps drive returns up higher. But getting from 40% to 50% is different. It's a different set of plays that are required than getting from 0% to 40%. And the reason I bring that up is because I think it's that value segment from 40% to 50% that's an important segment for us moving forward to add new accounts that we can do on an accretive basis. And so for those of you that are looking at new accounts, that's a driver of it. For those of you who are looking at ARPU temperament, it's entirely economically rational and value creating and the right thing for AT&T to do to get from 40% to 50%, even if it means we take some ARPU dilution to do that.
p. 11 · Read in context →
Altice USA (Optimum Communications) (ATUS)
Altice is the closest thing to a control experiment for the cable thesis: the same HFC product and the same competitive set as Charter, but without the balance-sheet room or the scale to absorb it. Its filings are also one of the few places a competitor describes Charter as the aggressor — Charter appears by name as an overbuilder inside Altice's own footprint. What happens to franchise values and broadband ARPU in that setting is the downside case made concrete.
Charter described from the receiving end. Altice's own 10-K names Charter alongside Comcast as a large national provider deploying fibre and network overbuilds into Altice territory — a reminder that Charter's expansion spend lands in someone else's footprint, not only in rural subsidy areas. The same section shows how thoroughly Altice itself is overbuilt: fibre available to over two-thirds of households across its New York, New Jersey and Connecticut markets, and Verizon reaching further still through the Frontier acquisition. Altice cautions in the same section that competitor build-out is difficult to assess because it rests on visual inspections and other limited estimating techniques, so these are approximations rather than measured counts.
Item 1, Business — 'Broadband Services Competition', FY2025 Form 10-K: Our primary fiber-based competitors include AT&T and Verizon Communications Inc.'s ("Verizon") Fios (including the assets recently acquired from Frontier Communications Parent, Inc. ("Frontier")). T-Mobile fixed wireless, Verizon fixed wireless, and AT&T Internet Air are our primary wireless broadband competitors. In addition to smaller and regional overbuilders, which use an existing telecommunications operator's network to provide their services, as well as newer fiber providers such as Tachus and T-Fiber, large national providers such as Comcast and Charter are currently deploying significant fiber and network overbuilds in portions of our footprint, increasing the intensity of competition in certain markets. […] We estimate that Verizon, together with other fiber-based service providers, is able to sell fiber-based services to over two-thirds of the households in our footprint in New York, New Jersey, and Connecticut combined […] As a result of Verizon's acquisition of Frontier, Verizon now offers DSL and FTTH broadband service and competes with us in most of our Connecticut service area, as well as parts of our Texas, West Virginia, Arizona, and California service areas. The Frontier acquisition has further consolidated the fiber broadband market and may increase competitive pressures in certain of our service areas.
p. 12 · Read in context →
A cable operator writing down $1.6 billion of indefinite-lived franchise rights and attributing it to competitive entry and low move activity that the original 2015–16 valuations did not contemplate. The value of a cable franchise is precisely what the Charter thesis turns on, so a peer marking its own down — and describing a step-change in competitive intensity in September 2025 — is a directly relevant data point. Altice's footprint is denser, more overbuilt and more levered than Charter's, so this is a bound on the argument rather than a read-through; impairment is also a non-cash accounting judgement about assets acquired at a particular price.
Dennis Mathew, Chairman and CEO, prepared remarks (Q3 2025 earnings call): Our results in the third quarter reflect shifting dynamics. The first part of the quarter was relatively stable, both against fixed wireless and fiber overbuilders. However, in September, competitive intensity significantly accelerated with aggressive offers paired with heightened marketing spend from our competitors, as well as elevated fixed wireless activity, which impacted our results. In the face of this, we remain disciplined by prioritizing financial stability and protecting margins over chasing lower-value gross additions. […] Reflecting this evolving competitive landscape, in the third quarter, we recorded a noncash impairment charge of approximately $1.6 billion related to our indefinite live cable franchise rights. The fair value of these assets was originally established during the company's formation in 2015 and 2016. Since then, competitive and macroeconomic pressures have evolved, including incremental market entrants and low move activity. The impairment reflects the anticipated persistence of these conditions for the foreseeable future, which are factors that were not contemplated in the original valuations at the time of the Cablevision and Suddenlink acquisitions.
p. 1 · Read in context →
Cable One, Inc. (CABO)
Cable One is the rural and small-market end of the same business, and it competes against exactly the alternatives that matter to Charter's rural expansion: fixed wireless from all three carriers, unupgraded ILEC copper, and low-earth-orbit satellite. Because it is small and late to mobile, its management is unusually explicit about what scale — and Charter's scale specifically — buys. Its structural view of where wired broadband share settles is the clearest peer statement of the terminal market question.
Charter and Comcast cited by a smaller peer as the proof case for cable mobile, and as the reason Cable One is launching its own six to seven years later. The useful detail is the lag Holanda describes: customer acceptance of a cable company selling mobile takes time, which is an argument that Charter's head start in Spectrum Mobile is a real asset rather than a commodity. On the same call Holanda separately conceded that Cable One does not have access to the programming arrangements that would put it 'in the same bucket as a Comcast or Charter'. This is one CEO's read of another company's history, offered while making the case for his own launch.
Jim Holanda, CEO, in Q&A with Sebastiano Petti, JPMorgan (Q4 2025 earnings call): Sebastiano, it's beneficial for us to continue discussions moving forward. Mobile is essential, as demonstrated by the experiences of Comcast and Charter over the past six to seven years. From my experience, it takes time for customers to adapt to the idea of a cable provider offering mobile services, and many of the midsized companies are encountering the same situation. It's not an instant success, but we've learned a lot from those who have gone before us about what attracts customers. This is crucial for how we approach our business and add value for our existing broadband customers, helping them save money on a monthly basis.
p. 7 · Read in context →
More peer documents
TMUS_annual_report_FY2025 — 234 pages · Item 1 lists Charter Communications first among the smaller and regional wireless competitors, and Item 1A names Charter again as a cable MVNO threat — T-Mobile's own record of where it places Charter. · Open →
Q4_FY2025 — 13 pages · Armstrong's defence of the free-line offer as 'a logical and, importantly, a rational competitive approach' — the fullest statement of the economics behind the mobile giveaway both cable operators are running. · Open →
Q2_FY2025 — 12 pages · Stankey's 2030 map to over 60 million owned-and-controlled fibre locations, plus his view that subscale overbuilders and open-access players face an unfavourable economic environment. · Open →
Q2_FY2025 — 15 pages · The earlier Verizon convergence and fixed-wireless discussion, useful as the pre-Frontier, pre-Schulman baseline against which the Q4 2025 strategy reset should be read. · Open →
Q2_FY2025 — 14 pages · Gopalan's fifth-largest-ISP framing and the arithmetic converting 12m FWA plus 12–15m fibre homes into a claimed 40–45 million homes-passed equivalent. · Open →
Source: S&P Capital IQ consensus via Xpressfeed · Generated 2026-08-03.
Consensus Tape
Charter's consensus tape carries no growth. Revenue is a flat line through FY2029 and EBITDA drifts lower to FY2028. What improves is cash: free cash flow rises 29.4% in FY2027 and 23.1% in FY2028 as the capex line steps down, and net debt falls to $81,310M. The street cut FY2027 normalized EPS -8.3% over six months while leaving revenue nearly alone, and its 17 price targets span $101 to $380.
FY2027 EPS, 6-month revision
FY2027 revenue, 6-month revision
FY2028E free cash flow ($M)
FY2028E capex ($M)
Source: derived from vendor data.
Six months of cuts landed on EPS, not on revenue
Source: derived from vendor data.
The two lines have not moved together, and the gap is the point. FY2027 normalized EPS stood at $48.11 six months ago and is $44.11 today, a move of -8.3%; FY2028 went from $53.52 to $48.47, -9.4%. Revenue over the identical window moved a fraction of that: FY2027 -1.9%, FY2028 -3.1%. A downgrade that lands almost entirely below the top line is a margin, capital-structure or below-the-line story, not a demand story — the feed does not identify which, and this tab does not guess.
The timing matters as much as the size. Nearly all of the cutting happened between six and three months ago. Since then FY2027 has gone sideways at best: -0.2% over 90 days and -1.2% over 30. FY2028 has gone the other way, +4.0% over 90 days and +2.8% over 30, recovering part of what it lost. On EPS, the near year is still leaking and the far year has stopped.
Revenue offers no such divergence. Every window on both years is negative — FY2027 at -0.3% over 90 days and -0.3% over 30, FY2028 at -0.6% on each — a slow, uniform trim rather than an inflection.
Revenue lands within a point of consensus every quarter; EPS does not
Source: derived from vendor data. Consensus is the figure standing immediately before each print, not today's restated estimate for that quarter.
The revenue line is close to pre-announced. Across eight quarters the largest beat is +0.98% and the largest miss -0.96%; the median-sized quarter is a rounding error. The last two prints were both beats, +0.41% and +0.14%, a streak of 2.
Normalized EPS behaves nothing like that. The same eight quarters split evenly, four beats and four misses, but the misses are the bigger ones: -10.5%, -8.98% and -6.06% against beats of +10.2%, +5.22% and +3.91%. The most recent quarter was a beat, +2.43%, and it follows a -8.98% miss — a streak of 1. There is no sandbagging pattern here to lean on: this is guidance the street misprices in both directions, in a business whose revenue it forecasts to within a point.
Source: derived from vendor data. Consensus is the figure standing immediately before each print.
Sorted on either surprise column the asymmetry is plain, and it lines up with the revision pattern above: the street models this top line tightly and the earnings line loosely, so an -8.3% cut to forward EPS beside a -1.9% trim to forward revenue is the same phenomenon seen from the other end.
Flat revenue and a falling EBITDA line, with free cash flow up two years running
Source: derived from vendor data.
The forward shape is unusually easy to read because nothing happens on the top line. Against FY2025 revenue of $54,774M, consensus has -0.9% in FY2026, -1.0% in FY2027, +0.1% in FY2028 and +0.5% in FY2029. EBITDA does slightly worse for three years and then turns: -2.0%, -1.6%, -0.5%, then +2.0%. Four years of consensus, and the operating base ends roughly where it started.
Free cash flow is the exception, and it is not an operating exception. Cash from operations is $16,238M in FY2026 and $16,343M in FY2029 — unchanged for practical purposes. Free cash flow, meanwhile, rises +29.4% in FY2027 and +23.1% in FY2028 to $7,485M, then eases -5.1% in FY2029. The difference sits in the capex line, which the street has stepping down through FY2028 and holding there. Whether that step-down is a spending-cycle assumption or a modelling convenience is a driver-level question; the Visible Alpha tab carries the broker build-ups.
Net debt follows the cash: $92,397M in FY2026 down to $81,310M in FY2029 on consensus means. And earnings rise while EBITDA falls — normalized EPS goes $41.74, $44.11, $48.47 across FY2026 to FY2028, +15.3%, +5.7% and +9.9% year over year. Growth in the earnings line is not coming from the operating line. The feed does not say what supplies it, and this tab will not invent a bridge.
The street agrees on revenue and splits on EPS
Source: derived from vendor data.
On revenue the street is close to unanimous. 18 analysts put FY2026 between $53,913M and $54,442M; 17 put FY2027 between $52,951M and $54,381M. Even FY2028, on 13 analysts, holds a band of $52,202M to $55,535M. EBITDA is looser but still orderly: $20,437M to $22,912M in FY2027 on the same 17.
Normalized EPS is a different picture entirely. FY2027 runs $36.25 to $49.60 across 13 analysts; FY2028 runs $34.21 to $59.33 across 9. The high FY2028 estimate is not a variant view of the top line — revenue and EBITDA barely move across the same forecasts — so the disagreement sits below EBITDA. That is consistent with everything above: the tightly forecast revenue line, the loosely forecast earnings line, and a six-month revision cycle that hit EPS several times harder than revenue.
17 price targets span $101 to $380, and the book is hold-heavy
Low target
Median target
Mean target
High target
Source: derived from vendor data.
Source: derived from vendor data.
The target range is the widest thing on this page: the high is nearly four times the low. The mean of $184.41 sits well above the median of $150, so the upper end is a thin tail rather than the centre of opinion — reading the mean as the street's view would misstate it. The recommendation book says the same thing in a duller way: 11 holds against 5 buys and no outperforms, with 3 sells and 2 underperforms behind them, and a consensus recommendation score of 2.90.
This tab carries no share price, so none of the above is an upside calculation. What it does show is that a business the street can forecast to within a point on revenue produces a near-fourfold spread in what analysts think the equity is worth — and the EPS dispersion two sections up is the most likely place that spread lives.
Visible Alpha broker models via S&P Xpressfeed · 19 brokers · 441 line items · freshest revision 2026-07-27.
Broker Models
Brokers do not model growth here. Revenue and EBITDA fall in every modeled year to FY-2028 and broadband subscriber losses widen. What the models do carry is a cash inflection: capital expenditure rolls off as the build program ends, and the diluted share count falls by roughly a quarter, so modeled free cash flow per share more than doubles. The genuine disagreement in this feed is over how much stock gets retired — not over the income statement.
The model is a cash story, not a growth story
Revenue, FY-2028
FCF per Share, FY-2028
Capital Expenditure, FY-2028
Diluted Shares, FY-2028
Source: derived from vendor data.
Those four tiles are the whole argument. Revenue in FY-2028 is modeled below FY-2025; capital expenditure is roughly a third lower; and the share count is roughly a third lower again. Free cash flow per share is the only headline number in the set that goes up materially, and it does so because the denominator shrinks alongside the cash outflow.
The capex cycle turns in FY-2027, and that is the entire inflection
Source: derived from vendor data.
Capital expenditure is modeled flat through FY-2026 and then drops in each of the next two years, and by FY-2028 free cash flow has closed most of the gap to it. The split view shows this is not one program ending. Line extensions — the subsidized rural build — come down every year from FY-2025. Everything else actually rises into FY-2026 before falling, which is why the cash benefit lands in FY-2027 rather than immediately.
Free cash flow per share more than doubles, and the buyback does much of the work
Source: derived from vendor data.
The mean path runs $35.42, $39.93, $54.88, $81.53 — an inflection with almost nothing to do with trading performance. Underneath it are two separate estimates, and only one of them is agreed.
Source: derived from vendor data.
Here is where the estimates come apart. Through FY-2026 the models sit within a few dollars of each other on cash per share and within a few million shares of each other on the count. By FY-2028 the most aggressive model has retired enough stock to leave a share count barely over half the most conservative one, and the per-share cash figure inherits that fan directly: the top model carries more than half again the free cash flow per share of the bottom one. Brokers broadly agree on the cash; they disagree on how many shares are left to divide it by.
Broker dispersion sits in capital allocation, not the income statement
Source: derived from vendor data.
Read the table by relative width rather than absolute dollars. FY-2028 revenue is a tight consensus and EBITDA nearly as tight. Share repurchases are the outlier: the highest model buys back close to three times what the lowest one does, from a cash pool the same brokers size within a much narrower range. Headline P&L consensus and its revision history live on the CapIQ tab; the value added here is that the argument sits one line below it.
Mobile is the only product adding customers — and it is decelerating
Source: derived from vendor data.
Mobile carries the volume story and the models fade it every year. Broadband moves the other way: internet losses widen from FY-2025 into FY-2027 before easing slightly, and the quarterly path is the more uncomfortable read — the modeled loss deepens in almost every quarter through to 2QFY-2027. Video and voice losses shrink, but from a smaller base. The crossover is the point worth holding: on the mean paths shown, mobile line additions cover the combined internet, video and voice losses in FY-2025 and FY-2026, and stop covering them from FY-2027.
Mobile's economics are the thinnest-covered numbers in the set
Source: derived from vendor data.
The direction is consistent — the mean mobile EBITDA path rises every year — but the level is barely agreed. For FY-2026 the four models span roughly a three-fold range on mobile EBITDA while sizing mobile revenue within about a quarter of each other. In other words, the disagreement is about mobile's cost base, not its scale. Given how much of the equity story rests on mobile, that is the least well-covered line that matters.
Broadband loses volume, not price; video loses both
Source: derived from vendor data.
Residential internet pricing is modeled essentially flat — $71.19 in FY-2025 against $71.31 in FY-2028 — so the entire modeled decline in internet revenue is subscribers walking out, not discounting. Video is the opposite: monthly revenue per video subscriber falls from $94.88 to $81.73, and the subscriber base falls too. Mobile line ARPU inches up, which is why mobile revenue grows faster than its already-decelerating line additions.
Source: derived from vendor data.
Mobile service is the only large line the models grow meaningfully, and it does not grow by enough: the modeled gain there is smaller than the modeled loss across internet, video and voice combined. Commercial revenue is modeled as near-static — a segment with over seven billion dollars of revenue that the models expect to do almost nothing for three years, which is itself a claim worth testing.
Leverage barely moves, because the cash goes to shareholders
Source: derived from vendor data.
Net debt to EBITDA improves only from 4.2 times to 3.94 times across four modeled years, and part of that is arithmetic working against the models — EBITDA is falling, so holding the ratio flat requires paying debt down. The models are not deleveraging Charter; they are running it at roughly constant leverage and directing the growing free cash flow at the share count. That is a coherent plan and it is what the per-share numbers on this page depend on, which is why the share-count dispersion above is the line to watch.
Headline P&L consensus, momentum and beat/miss live in the CapIQ tab.
Source: S&P Capital IQ transcripts via Xpressfeed · latest indexed call 2026-07-24 · generated 2026-08-03.
Latest call digest
Charter Communications, Inc., Q2 2026 Earnings Call, Jul 24, 2026 · 2026-07-24T12:00:00
Q2 2026 call, July 24, 2026 (Chris Winfrey, CEO; Jessica Fischer, CFO; Stefan Anninger, IR).
Prepared remarks led with the parts of the business that are working and with cash flow rather than units. Mobile added over 400,000 lines and video losses narrowed to 21,000, but Internet lost 172,000 customers, worse than a year ago, with management attributing the gap to softer gross additions rather than churn. Revenue fell 1.7% and EBITDA excluding Cox transition expenses fell 3.2%. Winfrey conceded that "Internet customer growth is taking longer to reverse" while arguing the cash flow ramp is not in doubt.
The stated guidance was mostly a step down. Standalone 2026 EBITDA excluding transition costs is now expected to decline around 1% year-over-year, against the slight growth guided in January and reaffirmed in April; Winfrey added that the company is "actually targeting to do better." Capital expenditures of approximately $11.4 billion for standalone Charter were reiterated, as was the sub-$8 billion run-rate figure. Cox closing was pushed to mid- to late August, with run-rate transaction expense synergies still at least $800 million and Winfrey saying he thinks it grows to $1 billion. The balance sheet was the largest change: the post-transaction leverage target moved to a flat 3.5x within three years of the Cox and Liberty Broadband closings, a $20 billion capped exchange offer was launched, and buybacks were paused through the end of the third quarter, expected to restart in the fourth.
Q&A was short, only four analysts, and did not go where the prepared remarks pointed. No one asked about the broadband subscriber trajectory directly. Instead, three of the four questioners pushed on wireless architecture and possible partnerships, including two attempts to get management to say whether it would spend capital alongside a network builder. Moffett's request for an updated full-year broadband ARPU outlook drew a sequential answer plus a reminder that Charter does not manage to product-level ARPU. The most candid moment was Winfrey taking personal responsibility for the first-quarter retention offers that carried into the second quarter and pressured ARPU.
Participant coverage from the latest call.
| Group | Participants | Count |
|---|---|---|
| Management | Operator; Stefan Anninger — Vice President of Investor Relations, Charter Communications, Inc.; Christopher Winfrey — President, CEO & Director, Charter Communications, Inc.; Jessica Fischer — Chief Financial Officer, Charter Communications, Inc. | 4 |
| Analysts | Craig Moffett — Co-Founder, Founding Partner Senior Managing Director & Senior Research Analyst, MoffettNathanson LLC; Vikash Harlalka — Director on the US Communications Services Team & Lead Analyst, New Street Research LLP; Steven Cahall — Senior Analyst, Wells Fargo Securities, LLC, Research Division; Walter Piecyk — Partner & TMT Analyst, LightShed Partners, LLC | 4 |
Curated latest-call exchanges; one row per analyst topic.
| Analyst | Firm | Topic | What changed in Q&A |
|---|---|---|---|
| Craig Moffett | MoffettNathanson LLC | Full-year broadband ARPU outlook and mobile traffic offload | Asked Fischer to update the positive broadband ARPU outlook given roughly two quarters earlier. She said ARPU improves sequentially in Q3, cited the late-July and early-August cost pass-through, and redirected to connectivity and customer-relationship ARPU rather than a full-year broadband ARPU number. Winfrey added that the offload rate moved from 88% down to 87% in the quarter because product changes drove more 5G usage, not less WiFi offload. |
| Vikash Harlalka | New Street Research LLP | Why the 2026 EBITDA goal was lowered, and reported Starlink partnership | Fischer pointed to weaker broadband subscriber and ARPU expectations after offers that did not work as hoped, plus fuel and medical cost pressure, and listed benefit-plan and overhead simplification as offsets. Winfrey stressed the outlook is what was provided but the company targets better. On Starlink he declined to discuss any specific conversation, saying only that Charter talks to many industry players. |
| Steven Cahall | Wells Fargo Securities, LLC, Research Division | Wholesale/partnership use of the network, and Cox Internet trends | Winfrey answered the partnership half at length, citing the Amazon fleet offload deal and the Bryte IQ platform, and IR moved to close the question before Winfrey returned to the unanswered Cox half. On Cox he said trends on subscribers and revenue have been a couple of clicks lower than Spectrum's, with no dramatic change since signing and no change to the playbook. |
| Walter Piecyk | LightShed Partners, LLC | Whether Charter would fund a wireless network build to close the remaining offload gap | Piecyk reopened Cahall's question, saying the point was joining a network build rather than wholesaling hotspots. Winfrey said there are no plans to change the capital expenditure trajectory and Fischer added any such opportunity would be looked at off balance sheet. On a follow-up about offload mix, Winfrey said the low-90s target is unchanged, with the mix moving from owned WiFi to out-of-footprint cable WiFi and, increasingly, CBRS. |
Theme tracker
Themes are curator-classified across supplied calls.
| Theme | Status | Quarters mentioned | Read-through |
|---|---|---|---|
| Broadband subscriber losses driven by top-of-funnel weakness rather than churn | persisted | Q4 2023, Q1 2024, Q2 2024, Q3 2024, Q4 2024, Q1 2025, Q2 2025, Q3 2025, Q4 2025, Q1 2026, Q2 2026 | The stated cause has migrated. In 2024 the losses were framed as ACP-driven and temporary; from Q3 2025 onward management has described gross additions as the problem, with churn at or near historic lows. Q2 2026 is the first call where management says the reversal is taking longer than expected while still declining to date it. |
| Convergence: mobile and video as levers on broadband churn and acquisition | persisted | Q3 2023, Q4 2023, Q1 2024, Q2 2024, Q3 2024, Q4 2024, Q1 2025, Q2 2025, Q3 2025, Q4 2025, Q1 2026, Q2 2026 | Present on every call in the supplied history and the most consistent element of the strategy. The framing has sharpened from Spectrum One free-line offers to explicit churn differentials for mobile and video attachment, and in Q2 2026 to selling Internet first with mobile and video upgrades after. |
| ACP wind-down and low-income connectivity | dropped | Q4 2023, Q1 2024, Q2 2024, Q3 2024, Q4 2024, Q1 2025, Q2 2025, Q3 2025, Q4 2025 | Dominated Q&A through 2024 and continued as a year-over-year comparison point into Q4 2025. It is absent from the Q1 2026 and Q2 2026 calls. The low-income segment itself has not gone away as a topic, resurfacing in Q1 2026 as a driver of the year-over-year gross-add variance. |
| Capital expenditure peak turning into a free cash flow ramp | persisted | Q4 2023, Q3 2024, Q4 2024, Q1 2025, Q2 2025, Q3 2025, Q4 2025, Q1 2026, Q2 2026 | The sub-$8 billion run-rate capital expenditure figure has been repeated since Q4 2024 without change. What has changed is the implied per-share arithmetic quoted alongside it, which has risen as the share count fell, and the free cash flow multiple management cites, which was about 3.8x in Q1 2026 and a bit over 2x in Q2 2026. |
| Leverage policy and the shift from levered equity to deleveraging | persisted | Q1 2024, Q3 2024, Q1 2025, Q2 2025, Q3 2025, Q4 2025, Q1 2026, Q2 2026 | The target has been ratcheted down four times in the supplied history: a 4.0x to 4.5x range with an explicit levered equity commitment, then post-close 3.5x to 4.0x targeting the midpoint, then the low end of 3.5x to 3.75x, then a flat 3.5x in Q2 2026 alongside a buyback pause, open-market debt repurchases and a capped exchange offer. Each step was attributed to investor feedback rather than to a change in the business. |
| Cox acquisition: approval timing, pricing migration and synergies | emerged | Q2 2025, Q3 2025, Q4 2025, Q1 2026, Q2 2026 | Introduced on the Q2 2025 call after the May announcement and now the frame for most forward statements. Timing slipped from mid-2026 to a summer close pending California, then to mid- to late August. The synergy estimate rose from $500 million to at least $800 million, with Winfrey saying in Q2 2026 he thinks it grows to $1 billion. |
| AI, first as a cost-to-serve lever and now as network demand and edge capacity | emerged | Q4 2024, Q1 2025, Q2 2025, Q3 2025, Q1 2026, Q2 2026 | Began as machine learning in frontline service tools, expanded in Q3 2025 into an agentic AI roadmap against an $8 billion cost to serve with benefits described as 12 to 18 months away, and by Q2 2026 became a demand and asset story about data center connectivity and edge power capacity. The service and cost claims are more specific than the revenue claims, which remain unquantified. |
| Video repositioned as a connectivity retention tool through app inclusion | persisted | Q1 2024, Q2 2024, Q3 2024, Q4 2024, Q1 2025, Q2 2025, Q3 2025, Q4 2025, Q1 2026, Q2 2026 | Management has repeated across calls that net video gains are not the goal and that the product exists to support broadband acquisition and churn. Video losses narrowed from 408,000 in Q2 2024 to 21,000 in Q2 2026, with a net gain of 44,000 in Q4 2025. App activation was over 50% of expanded basic video customers in Q1 2026 and 55% of eligible video customers in Q2 2026. |
Guidance ledger
Quotes, calls, and speakers are source-verified; outcomes are curator-classified.
| Verbatim guidance | Call | Speaker | Curator outcome | Outcome note |
|---|---|---|---|---|
| “Currently, for the full year 2026, we expect standalone Charter EBITDA, excluding the impact of transition costs, to decline around 1% year-over-year.” | Charter Communications, Inc., Q2 2026 Earnings Call, Jul 24, 2026 · 2026-07-24T12:00:00 | Jessica Fischer | pending | Set on the most recent call; no later call in the supplied history reports the outcome. Winfrey said on the same call that the company is targeting to do better. |
| “For standalone Charter, we continue to expect total 2026 capital expenditures to reach approximately $11.4 billion.” | Charter Communications, Inc., Q2 2026 Earnings Call, Jul 24, 2026 · 2026-07-24T12:00:00 | Jessica Fischer | pending | Unchanged from the same figure given on the Q4 2025 and Q1 2026 calls. |
| “we are lowering our post-transaction leverage target to a flat 3.5x, which we expect to achieve with consistent progress along the way, within 3 years of the close of the Cox and Liberty Broadband transactions” | Charter Communications, Inc., Q2 2026 Earnings Call, Jul 24, 2026 · 2026-07-24T12:00:00 | Jessica Fischer | pending | A three-year target set six months after the prior target of the low end of a 3.5x to 3.75x range. Fischer said leverage should be just above 3.9x at the end of the third quarter assuming the exchange offer succeeds. |
| “We still expect run rate transaction expense synergies of at least $800 million per year” | Charter Communications, Inc., Q2 2026 Earnings Call, Jul 24, 2026 · 2026-07-24T12:00:00 | Christopher Winfrey | pending | Raised from at least $500 million to at least $800 million on the Q1 2026 call. Winfrey said he thinks it will grow to $1 billion and that the estimate will be updated after close. |
| “For the full year 2026, we are planning for slight EBITDA growth, excluding the impact of transition costs.” | Charter Communications, Inc., Q4 2025 Earnings Call, Jan 30, 2026 · 2026-01-30T13:30:00 | Jessica Fischer | missed | Reaffirmed on the Q1 2026 call, then replaced two quarters later when Charter guided full year 2026 standalone EBITDA excluding transition costs to decline around 1%. The full year result is not yet reported in the supplied history. |
| “We expect 2025 full year EBITDA growth to be flat or marginally positive year-over-year with higher underlying growth absent the impact of political advertising.” | Charter Communications, Inc., Q3 2025 Earnings Call, Oct 31, 2025 · 2025-10-31T12:30:00 | Jessica Fischer | kept | The Q4 2025 call reported full year 2025 EBITDA growth of 0.6%. |
| “We continue to expect total 2025 capital expenditures to reach approximately $11.5 billion, lower than our original outlook of $12 billion” | Charter Communications, Inc., Q3 2025 Earnings Call, Oct 31, 2025 · 2025-10-31T12:30:00 | Jessica Fischer | missed | The Q4 2025 call reported 2025 capital expenditures of $11.66 billion, which Fischer attributed to two multiyear software agreements accrued in the quarter. |
| “We still expect under existing tax legislation that our calendar year 2025 cash tax payments will total between $1.6 billion and $2 billion.” | Charter Communications, Inc., Q1 2025 Earnings Call, Apr 25, 2025 · 2025-04-25T12:30:00 | Jessica Fischer | missed | Cut to a bit over $1 billion on the Q2 2025 call after July federal tax legislation, and reported at just under $900 million on the Q4 2025 call. The variance is legislative, and the guidance was explicitly conditioned on existing law. |
| “We expect rural passings growth of approximately 450,000 in 2025, our biggest year so far” | Charter Communications, Inc., Q4 2024 Earnings Call, Jan 31, 2025 · 2025-01-31T13:30:00 | Jessica Fischer | kept | The Q4 2025 call reported subsidized rural passings growth of over 483,000 over the last 12 months, above the 450,000 target. |
| “after our evolution and expansion capital initiatives conclude, our run rate capital expenditures should be below $8 billion per year” | Charter Communications, Inc., Q4 2024 Earnings Call, Jan 31, 2025 · 2025-01-31T13:30:00 | Jessica Fischer | pending | Repeated in identical terms on every subsequent call in the supplied history, with 2028 given as the reference year and a $7.5 billion to $8 billion normalized range added in Q4 2025. |
| “We now expect total 2024 capital expenditures to reach approximately $11.5 billion, down from approximately $12 billion previously.” | Charter Communications, Inc., Q3 2024 Earnings Call, Nov 01, 2024 · 2024-11-01T12:30:00 | Jessica Fischer | missed | The Q4 2024 call reported 2024 capital expenditures of $11.3 billion, below both the revised figure and the original $12.2 billion to $12.4 billion expectation, on lower network evolution and line extension spend. |
Q&A pressure map
Question counts and firms are curator tallies; analyst coverage shown above.
| Topic | Questions | Firms | Pressure / response |
|---|---|---|---|
| Broadband growth and the competitive environment | 13 | MoffettNathanson LLC, New Street Research LLP, Morgan Stanley, Research Division, UBS Investment Bank, Research Division, Wells Fargo Securities, LLC, Research Division, Deutsche Bank AG, Research Division, Wolfe Research, LLC, Evercore ISI Institutional Equities, Research Division, Goldman Sachs Group, Inc., Research Division | The most persistent line of questioning across the last eight calls, and the one management answers most consistently: gross additions, not churn, with fiber overlap, cell phone Internet, low move rates and mobile substitution named each time. Notably absent from the Q2 2026 call, where none of the four analysts asked about the Internet subscriber trajectory. |
| Broadband ARPU and pricing strategy | 10 | MoffettNathanson LLC, New Street Research LLP, JPMorgan Chase & Co, Research Division, Citigroup Inc., Research Division, Wells Fargo Securities, LLC, Research Division, Morgan Stanley, Research Division, UBS Investment Bank, Research Division, Raymond James & Associates, Inc., Research Division | Analysts have repeatedly asked for a full-year broadband ARPU number and repeatedly been redirected. On the Q1 2026 call Fischer said it would be close either way; on the Q2 2026 call she gave a sequential answer and said Charter does not manage the business for product-level ARPUs. Winfrey added that he did not want to hamstring the company ahead of the new COO's arrival. The answer is a considered position rather than an evasion, but it is not the number that was asked for. |
| EBITDA guidance and the cost trajectory | 9 | UBS Investment Bank, Research Division, JPMorgan Chase & Co, Research Division, Morgan Stanley, Research Division, New Street Research LLP, Goldman Sachs Group, Inc., Research Division | Pressure here has been cumulative. Swinburne noted in Q3 2025 that fourth-quarter EBITDA had gone from less pressured to more pressured than previously signalled, and Fischer attributed it to offers pulled from the market in November. Harlalka opened the Q2 2026 call by asking what changed in six months to lower the full-year target. |
| Wireless offload, CBRS and MVNO economics | 9 | MoffettNathanson LLC, Morgan Stanley, Research Division, Wells Fargo Securities, LLC, Research Division, LightShed Partners, LLC, Evercore ISI Institutional Equities, Research Division | Moffett has tracked the offload percentage call by call, from 85% to 88% to roughly 89% and back to 87%. In Q2 2026 the topic took over the call: Cahall and then Piecyk pushed twice on whether Charter would put capital behind a network build, with Piecyk explicitly restating the question after the first answer addressed wholesale offload instead. |
| Capital intensity, leverage and capital returns | 9 | Morgan Stanley, Research Division, New Street Research LLP, JPMorgan Chase & Co, Research Division, MoffettNathanson LLC, UBS Investment Bank, Research Division, Wolfe Research, LLC, Goldman Sachs Group, Inc., Research Division, Wells Fargo Securities, LLC, Research Division | Supino's Q3 2025 question about what it would take for Charter to start paying down maturities, framed around what happens if broadband does not grow again, drew a defence of the existing target. Two quarters later the target was cut to a flat 3.5x, a capped exchange offer was launched and buybacks were paused, which is a fair read of that pressure having landed. |
| Cox integration, pricing migration and synergies | 8 | MoffettNathanson LLC, Wells Fargo Securities, LLC, Research Division, JPMorgan Chase & Co, Research Division, BofA Securities, Research Division, Morgan Stanley, Research Division, Raymond James & Associates, Inc., Research Division | The recurring question is how Charter lowers Cox's higher broadband pricing without damaging the financials. The answer has been consistent across Q2 2025, Q1 2026 and Q2 2026: lower product pricing, higher mobile and video attachment, customer-relationship ARPU held roughly intact. |
| Video, seamless entertainment and programmer app inclusion | 8 | BofA Securities, Research Division, Wells Fargo Securities, LLC, Research Division, Morgan Stanley, Research Division, UBS Investment Bank, Research Division, Deutsche Bank AG, Research Division | A standing question from Q3 2024 through Q4 2025, most often from Reif Cohen, and absent from both 2026 calls. Management's answer never changed: video exists to support broadband acquisition and retention, and net video gains are not the goal. |
Language shifts
Only language evidence verified against the referenced component is shown.
| Observation | Verbatim evidence | Call ID | Component |
|---|---|---|---|
| First explicit acknowledgment that the return to broadband growth is running behind, paired with an unhedged assertion about competitor supply. Prior calls described the recovery as a matter of timing and external variables rather than as delayed. | “And while Internet customer growth is taking longer to reverse, the growth of new competition will subside.” | 2008048266 | 2 |
| Personal accountability language that has no precedent in the supplied history. Prior explanations of offer missteps were given by the CFO in process terms; here the CEO attributes the decision and the delay in reversing it to himself. | “And it had some impact, but not enough to really merit what we did. So we pulled back. I own that.” | 2008048266 | 7 |
| Defensive framing on the balance sheet. Charter had previously described leverage targets as ranges it was comfortable with; this line pre-empts scepticism that a fourth successive reduction in the target will be delivered. | “Our leverage target is not aspirational.” | 2008048266 | 3 |
| The clearest withdrawal of a subscriber commitment in the history reviewed. In Q1 2025 Winfrey answered a direct question about whether the improvements would return Charter to positive broadband growth with an unqualified yes; nine months later he declined to project growth for the year. | “I'm not projecting broadband relationship growth this year, but we expect to see an improved trajectory from the investments we've made over the past 3 years.” | 1974724673 | 2 |
| New vocabulary positioning the network as AI infrastructure rather than consumer connectivity. Earlier AI references were about service costs and frontline tools; this is a demand and asset claim, and it arrives on the same call that lowered the EBITDA outlook. | “We provide the mission-critical AI infrastructure that will ultimately demand our superior speed, reliability and low latency capabilities.” | 2008048266 | 2 |
| A concrete reversal of the levered equity posture. Buybacks had been described across prior calls as a continuing use of free cash flow; here they are suspended, with the restart placed in the fourth quarter. | “Given the pending Cox closing and its financing and our focus on liability management, we have paused our share repurchases through the end of the third quarter.” | 2008048266 | 3 |
Three years of calls show a management team whose capital and cost commitments have generally been met or beaten and whose subscriber and EBITDA commitments have not. That pattern is the investment debate in miniature: the free cash flow ramp rests on capital spending that has repeatedly come in at or below plan, while the case for the multiple rests on a return to broadband growth that management has now stopped dating.