Charter Communications, Inc.'s management explains the business in its own materials. The slides below do the most of that work, pulled from the documents preserved in Sources. Each source link opens the complete presentation at that slide in a new tab.
Charter's most recent results deck: current scale, segment revenue, the capex step-down and the free cash flow case that rests on it. · Open the full document →
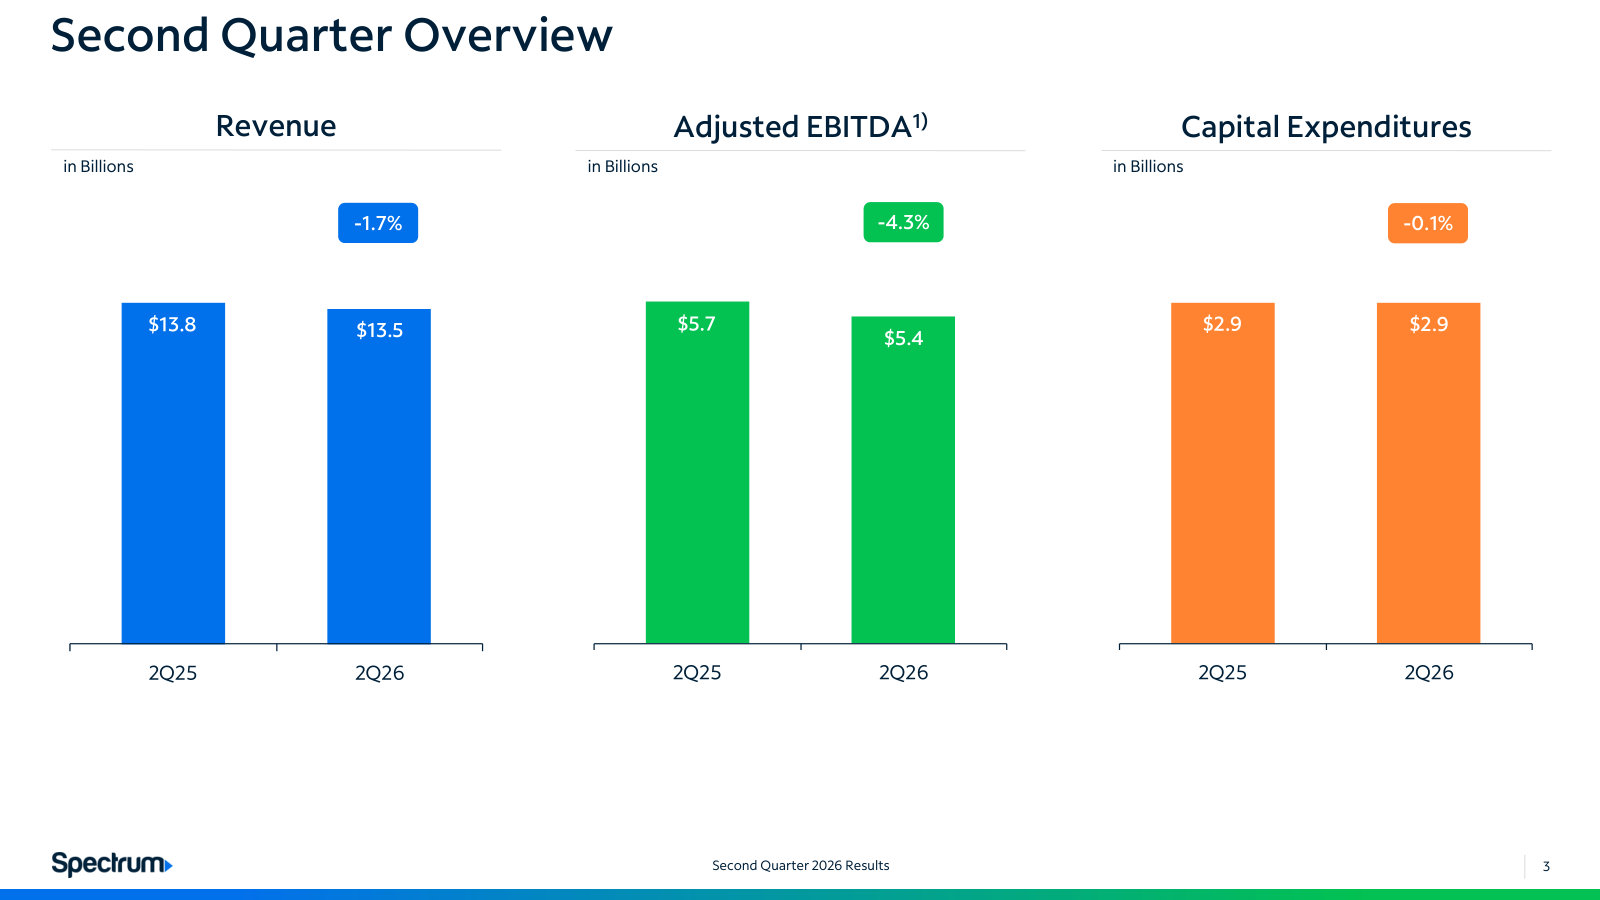
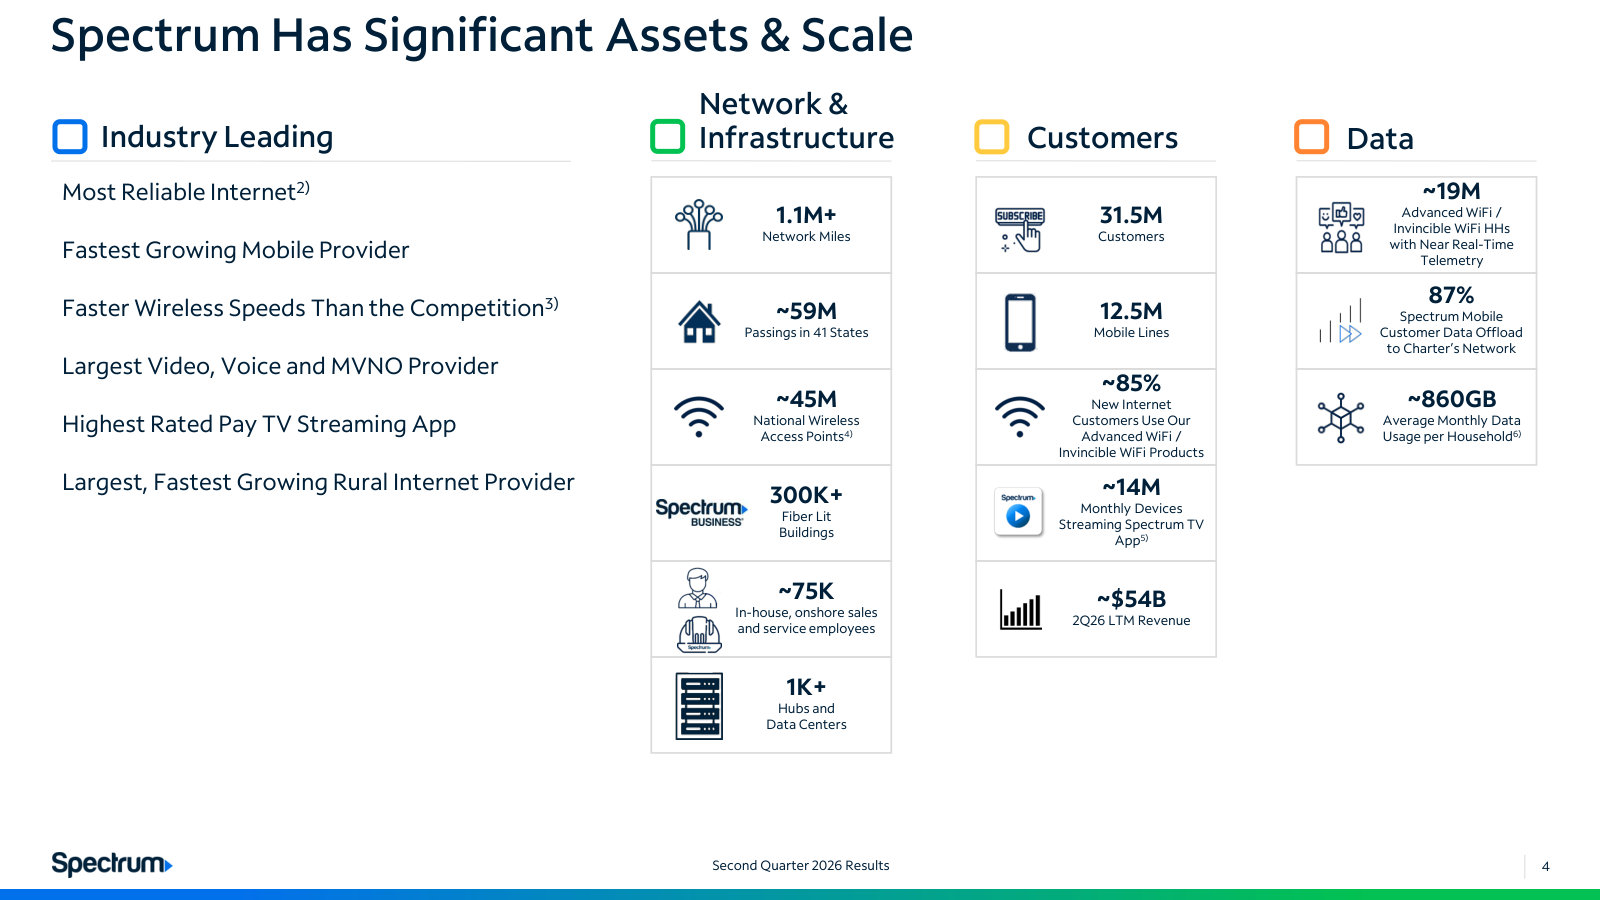
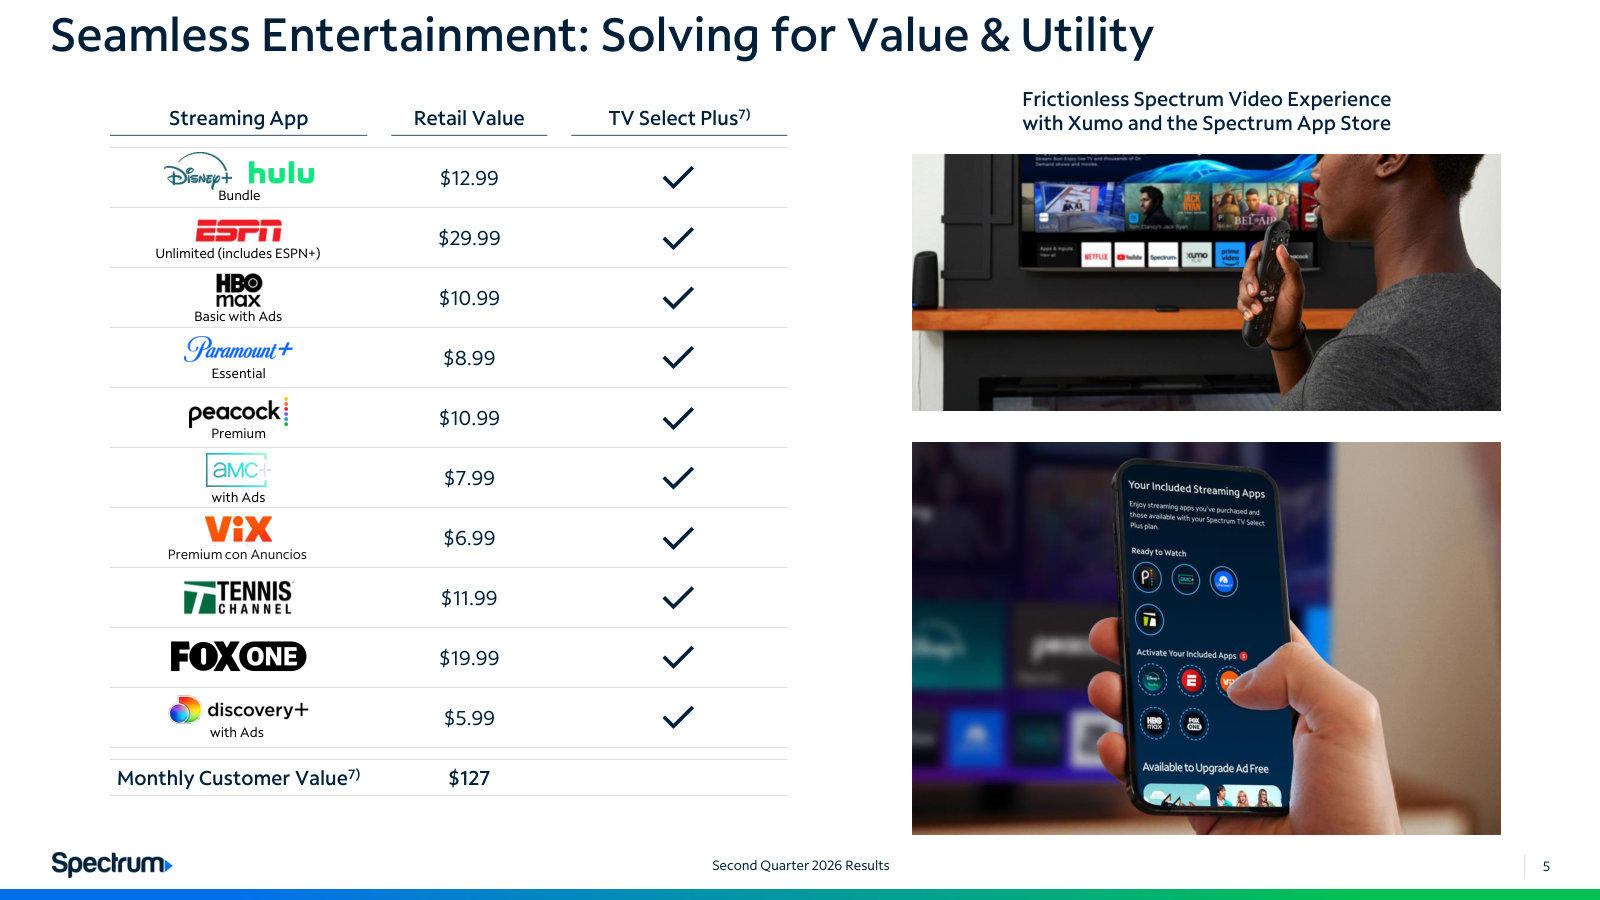
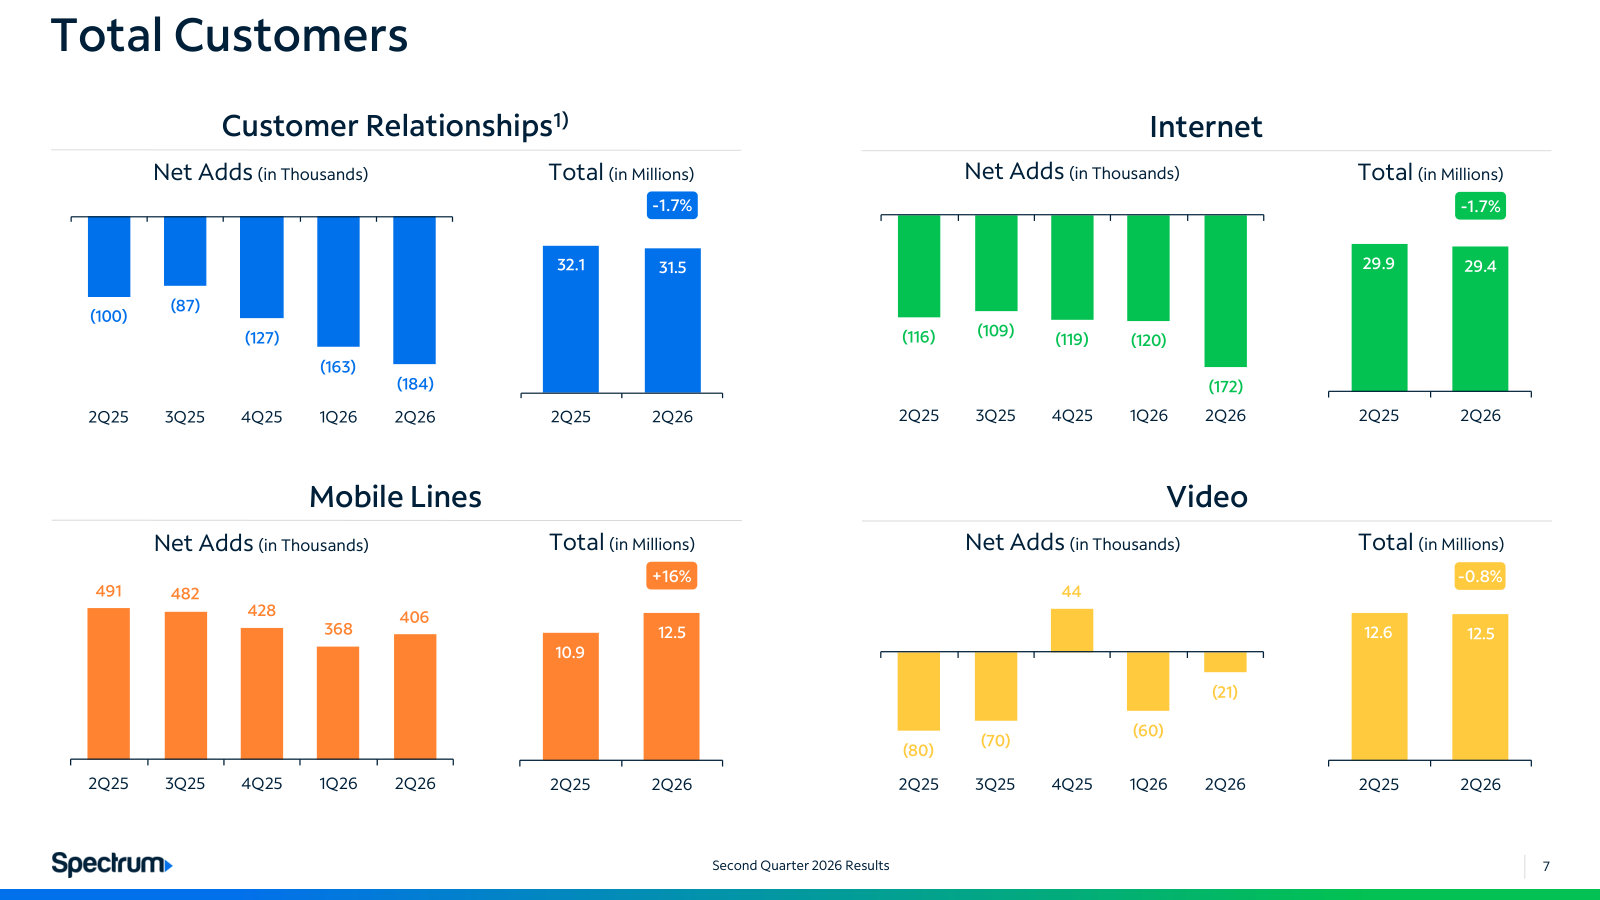
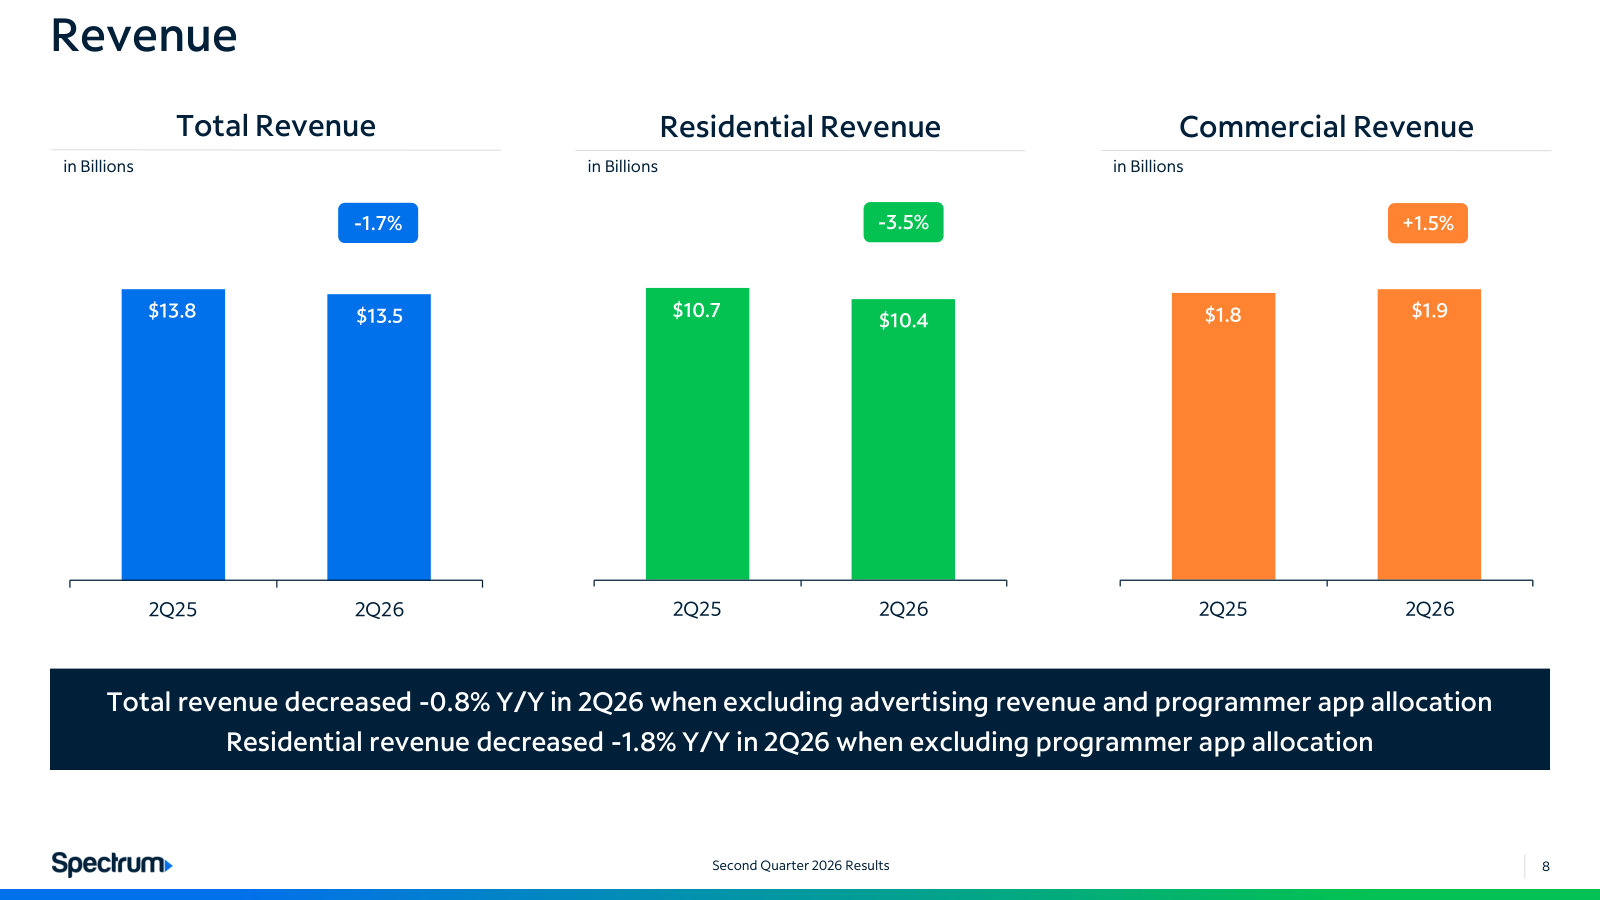
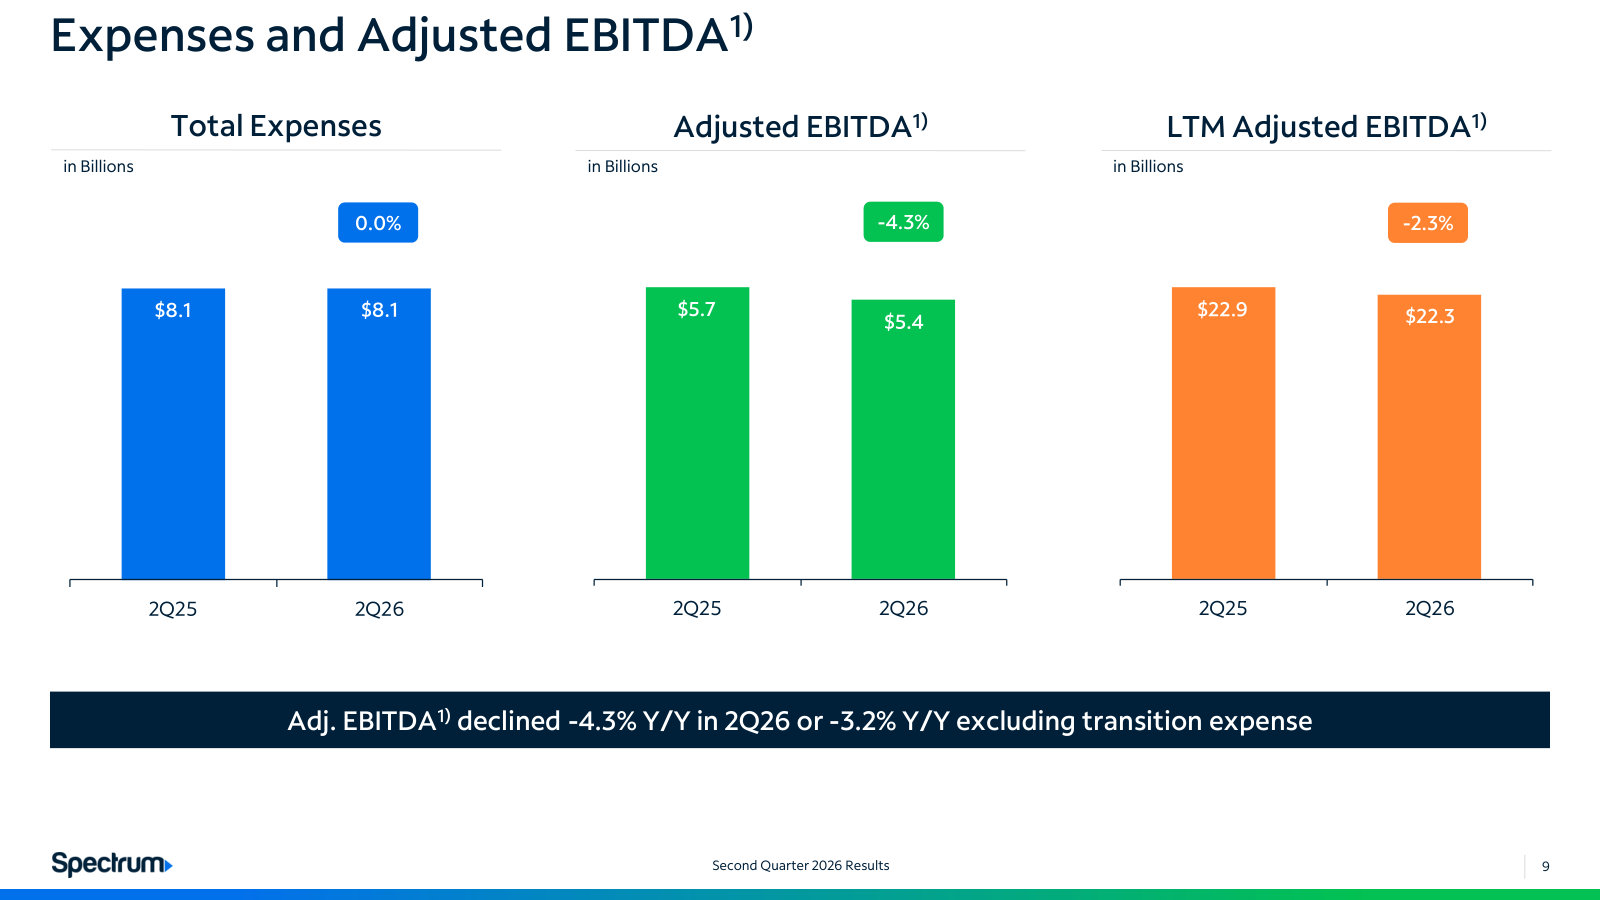
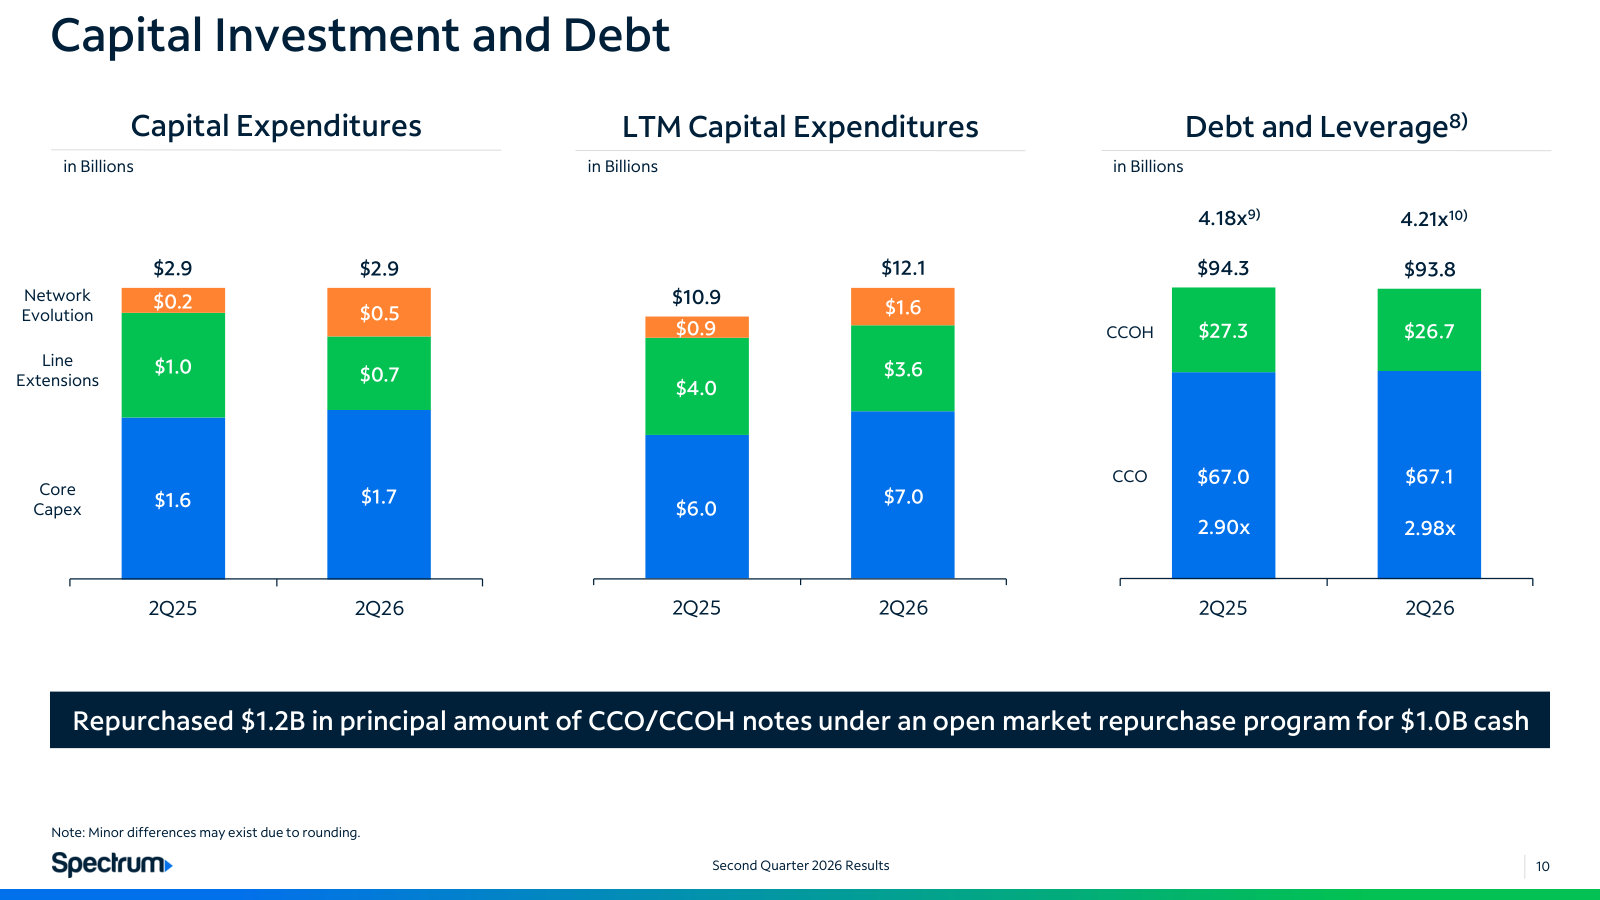
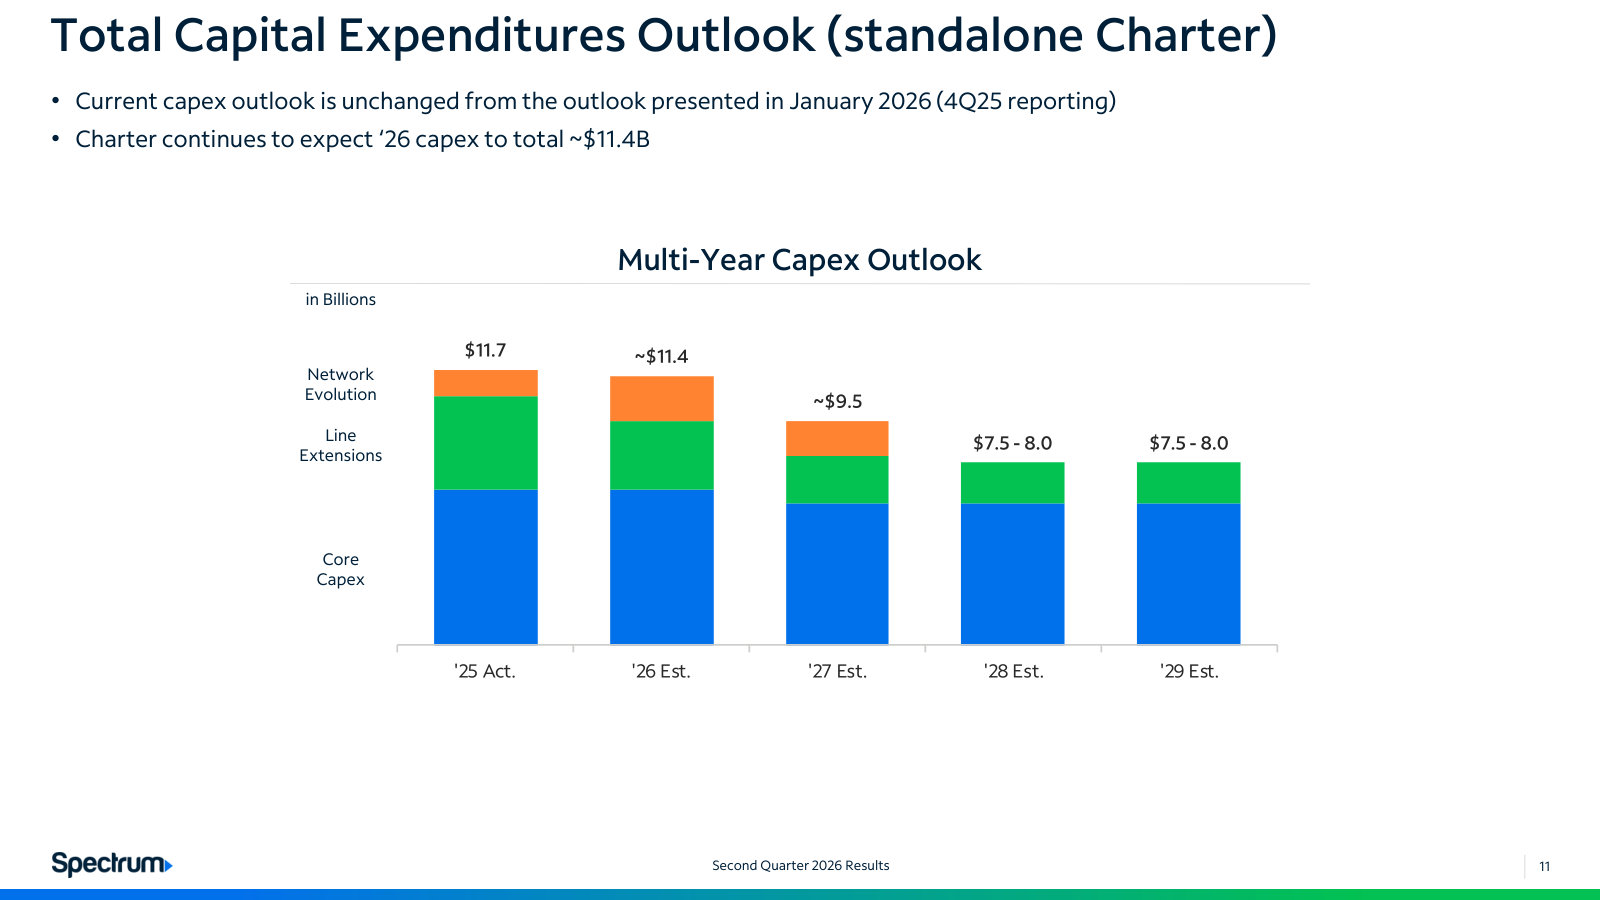
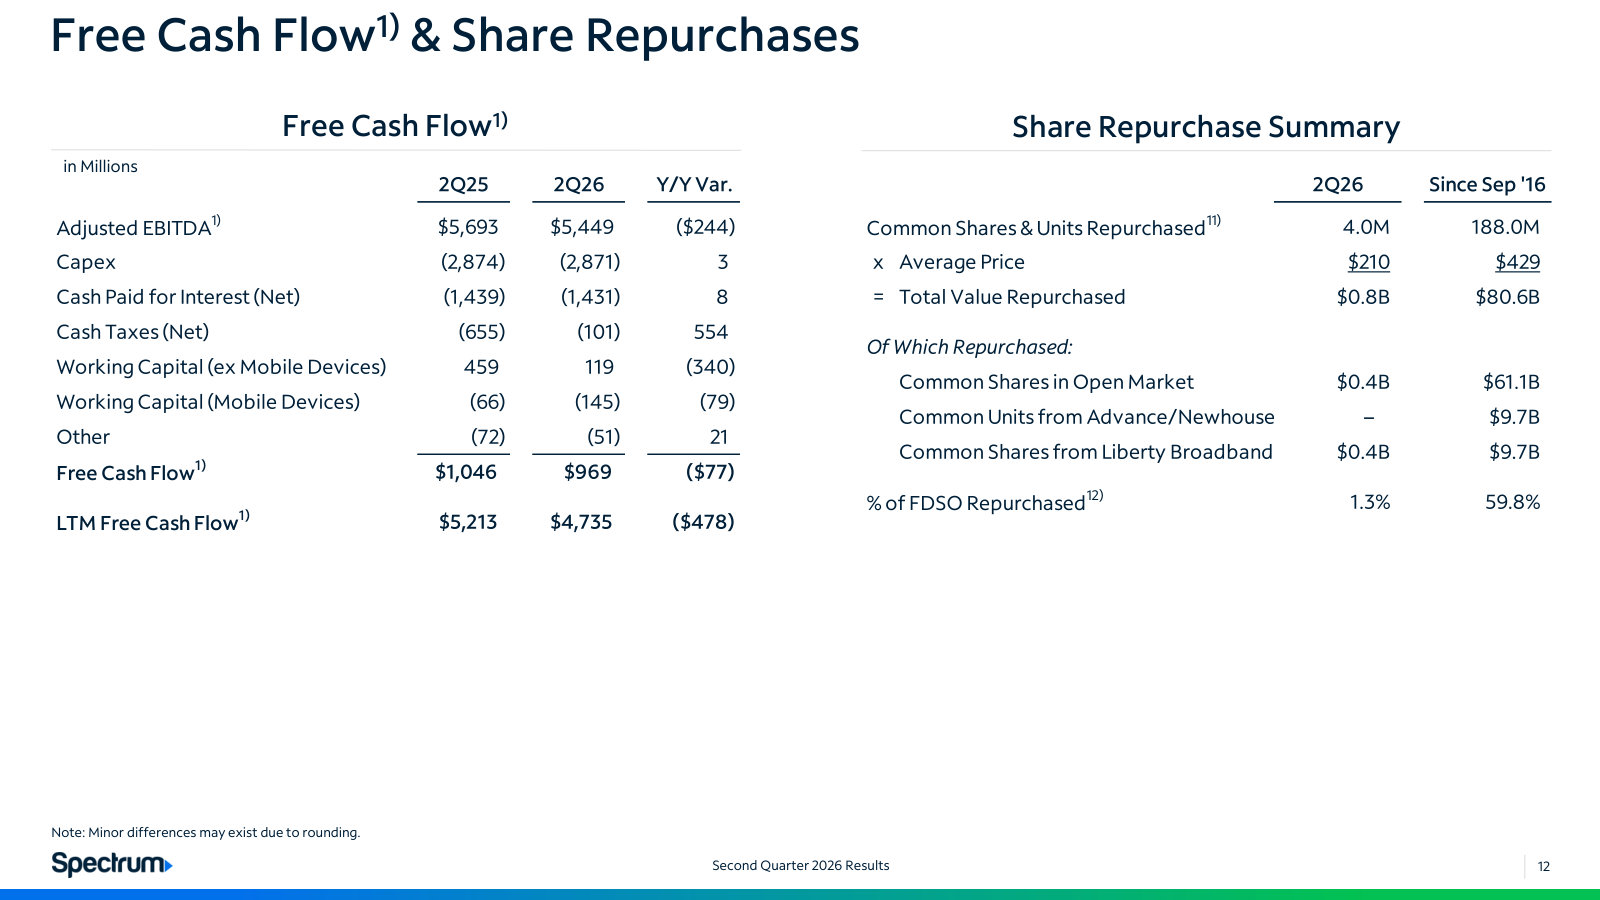
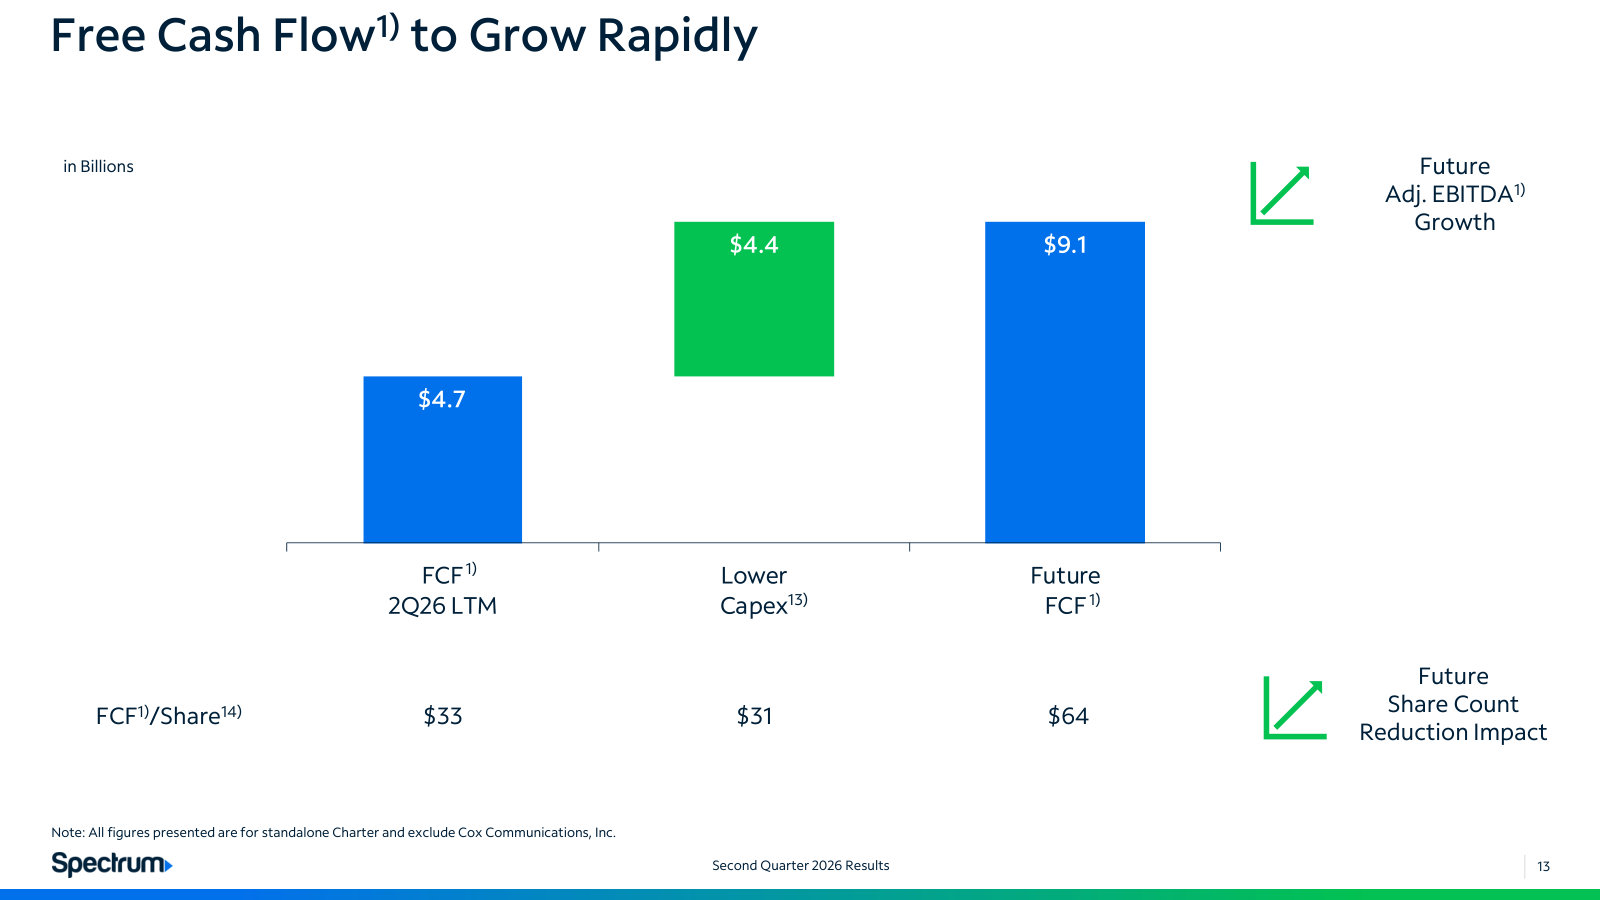
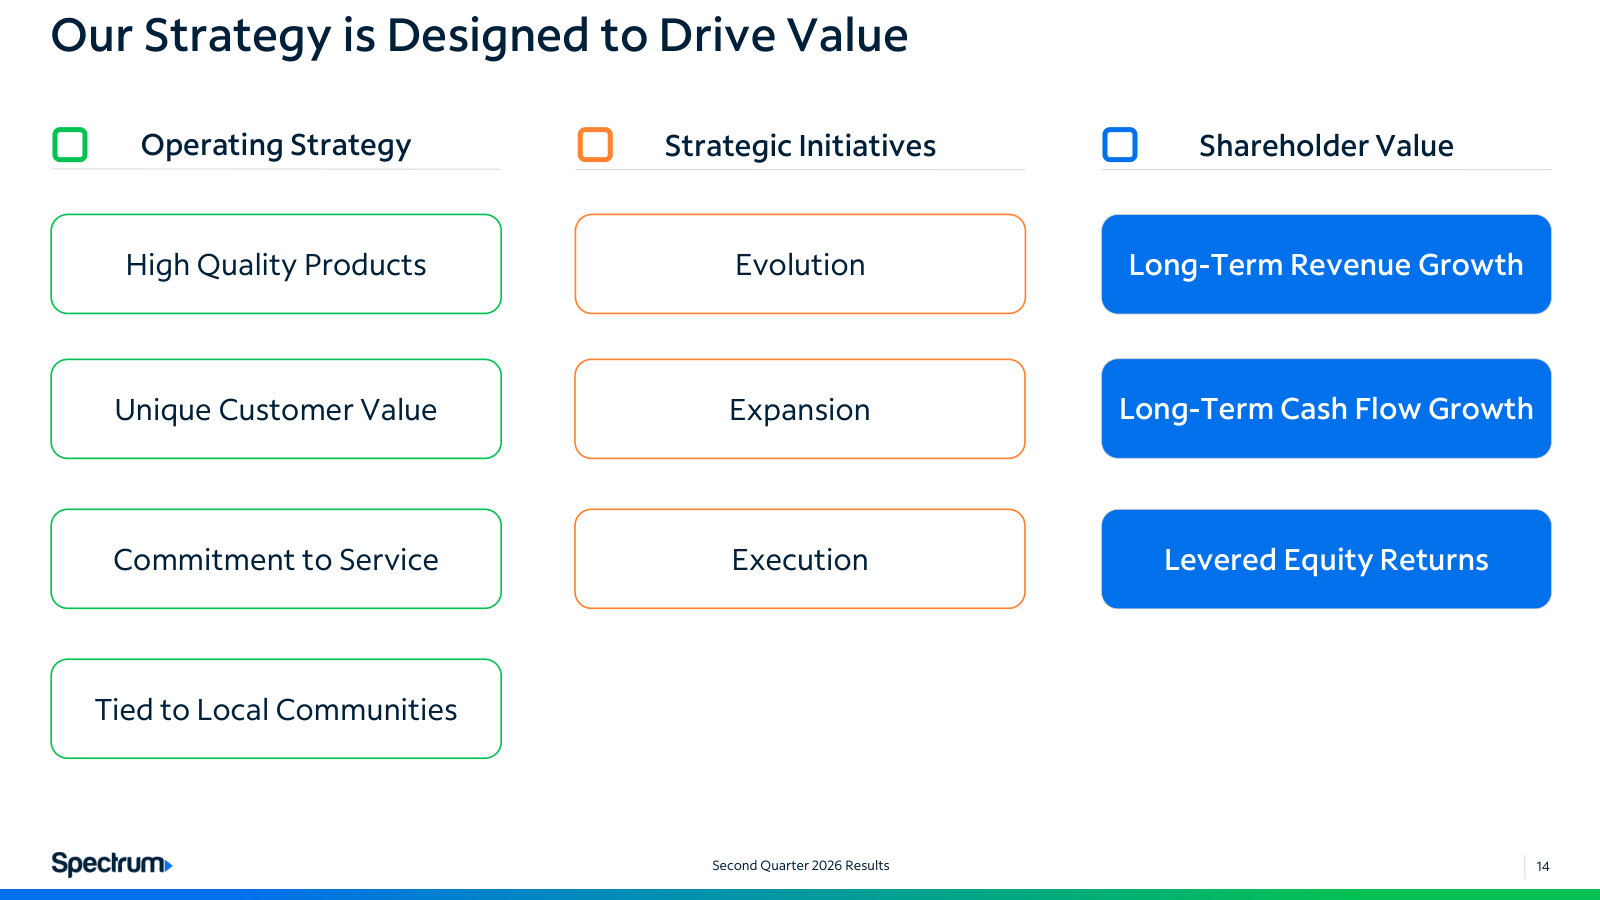
p. 4 — Second quarter 2026 at a glance: revenue $13.5B (-1.7%), adjusted EBITDA $5.4B (-4.3%), capex flat at $2.9B. · Open the full presentation →p. 5 — The asset base on one page — ~59M passings in 41 states, 31.5M customers, 12.5M mobile lines, ~860GB of monthly data per household. · Open the full presentation →p. 6 — Ten streaming apps bundled into TV Select Plus at $127 of monthly retail value — the mechanics of the video repositioning. · Open the full presentation →p. 8 — Where the subscribers are going: relationships and internet losing lines every quarter while mobile adds roughly 400K. · Open the full presentation →p. 9 — Revenue split residential versus commercial, with management's own adjustment for advertising and the programmer app allocation. · Open the full presentation →p. 10 — Expenses flat while EBITDA fell 4.3% — the margin squeeze, and what it looks like excluding transition expense. · Open the full presentation →p. 11 — Capex by type — core, line extensions, network evolution — next to $93.8B of debt at 4.21x leverage. · Open the full presentation →p. 12 — The capex path management commits to: ~$11.4B in 2026 falling to $7.5-8.0B by 2028-29, standalone Charter. · Open the full presentation →p. 13 — Free cash flow built up from EBITDA, and the buyback record: $80.6B spent and ~60% of shares retired since 2016. · Open the full presentation →p. 14 — The equity case in one chart — LTM FCF of $4.7B ($33/share) becoming ~$9.1B ($64/share) as capex steps down. · Open the full presentation →p. 15 — Management's own framing of operating strategy, strategic initiatives and the shareholder returns they are meant to produce. · Open the full presentation →
The full-year 2025 scorecard, plus the pricing comparison and service guarantees management uses to explain the value proposition. · Open the full document →
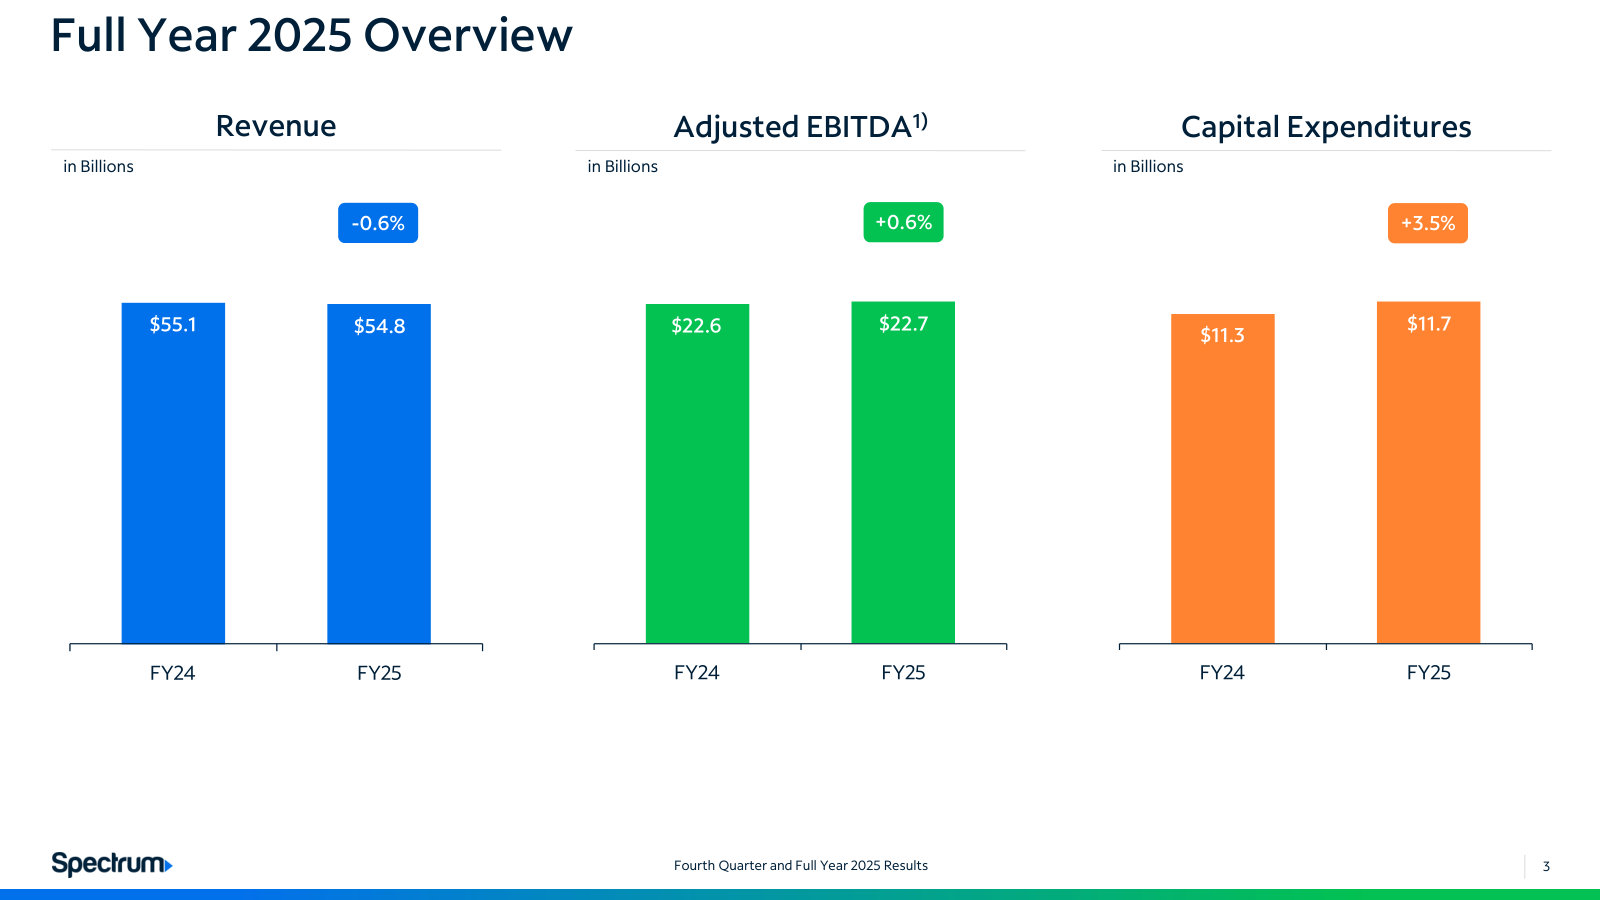
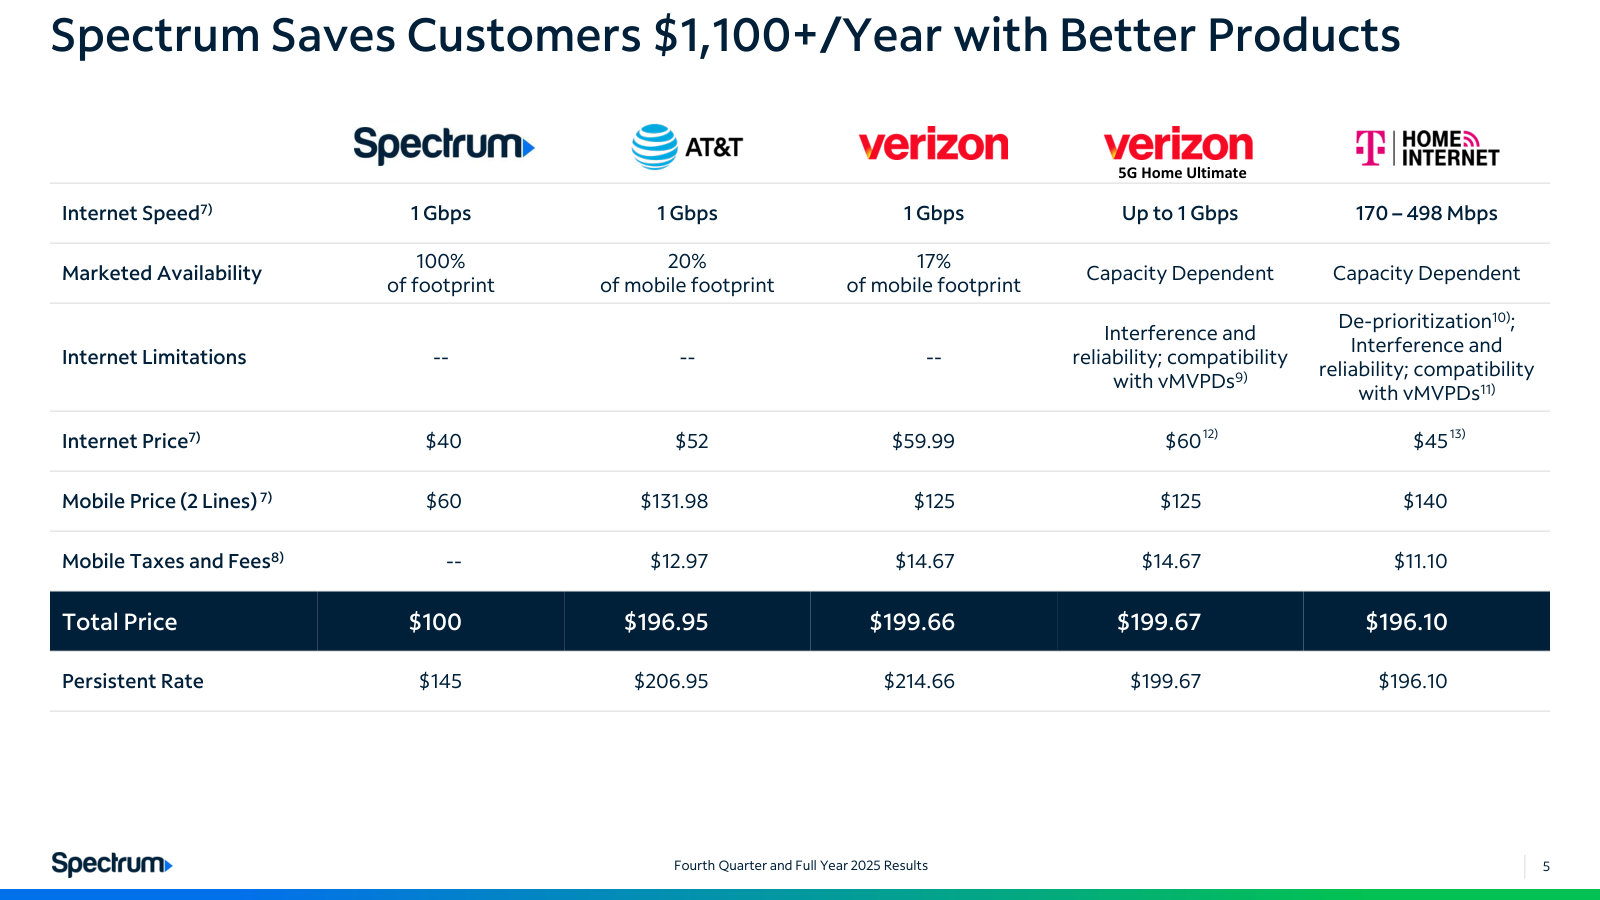
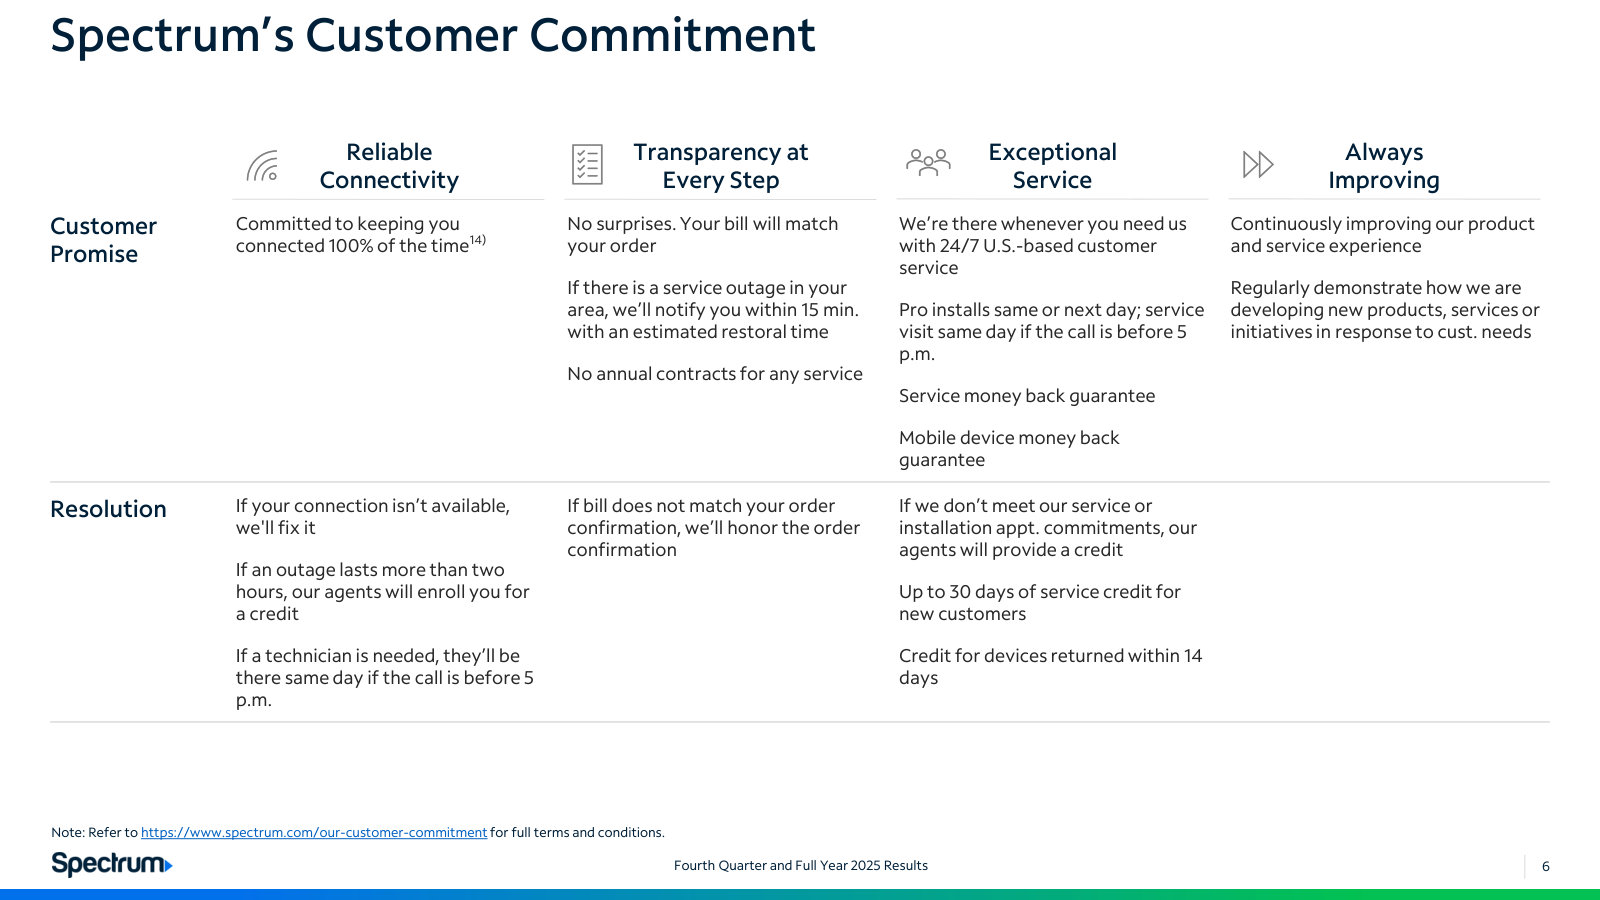
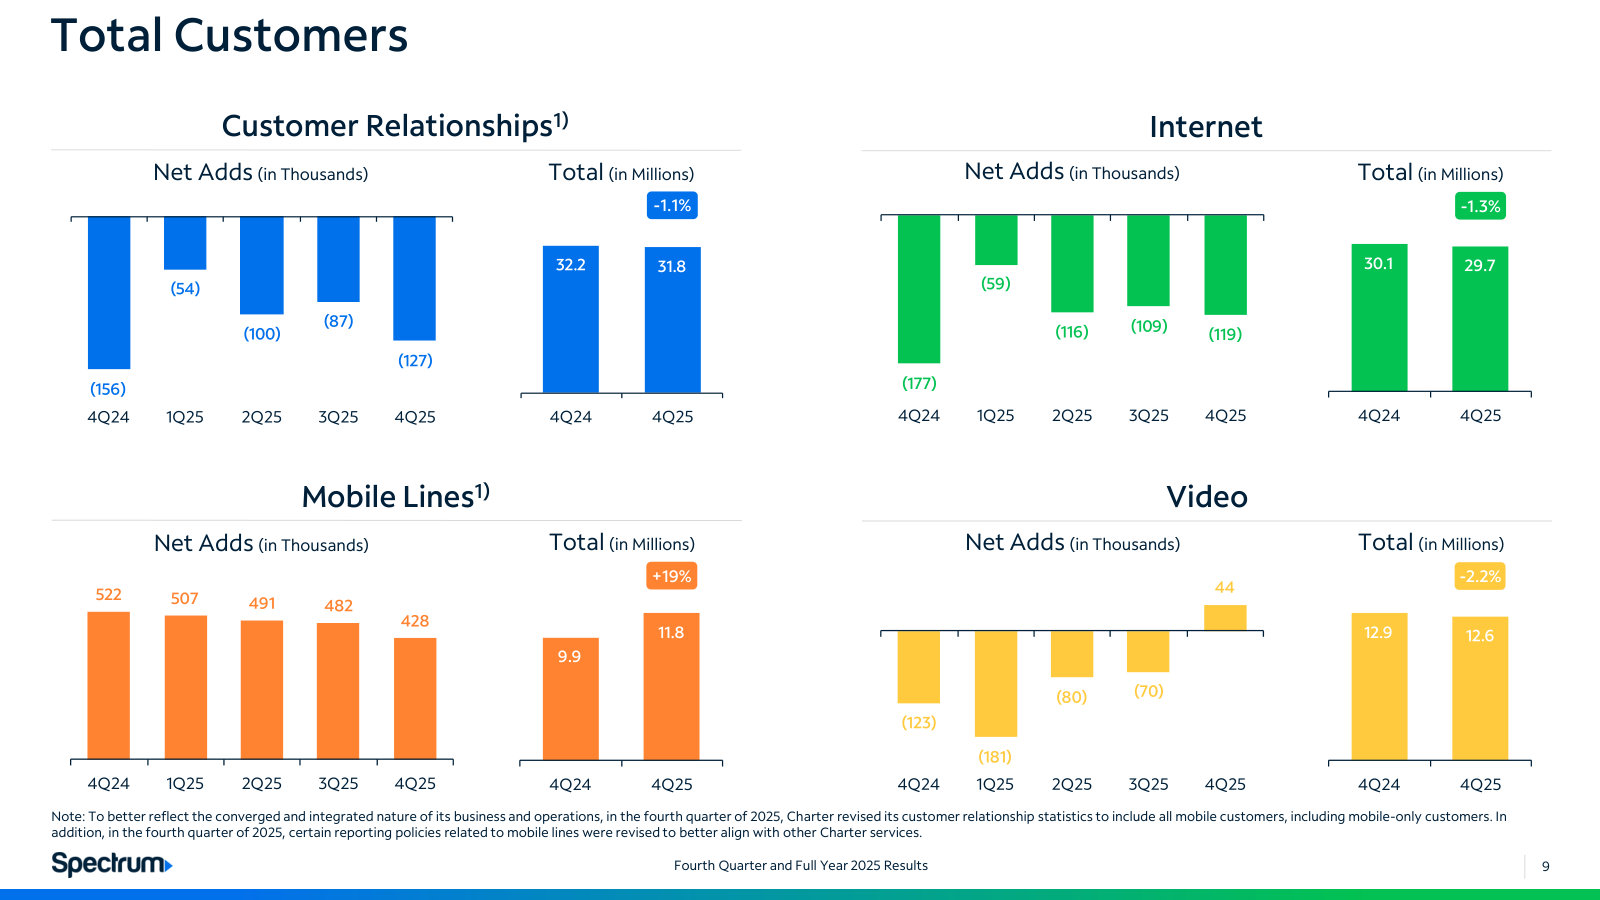
p. 4 — Full-year 2025 against 2024: revenue $54.8B, adjusted EBITDA $22.7B, capex up 3.5% to $11.7B. · Open the full presentation →p. 6 — The price argument against AT&T, Verizon and T-Mobile: $100/month for internet plus two mobile lines versus ~$197-200. · Open the full presentation →p. 7 — The service guarantees Spectrum publishes — outage credits, no annual contracts, U.S.-based support — and the remedy when they are missed. · Open the full presentation →p. 10 — Full-year customer trends, with the 4Q25 footnote restating customer relationships to include mobile-only customers. · Open the full presentation →
Included for two explainers later decks dropped: the mobile margin per line and the shift of the video base to IP. · Open the full document →
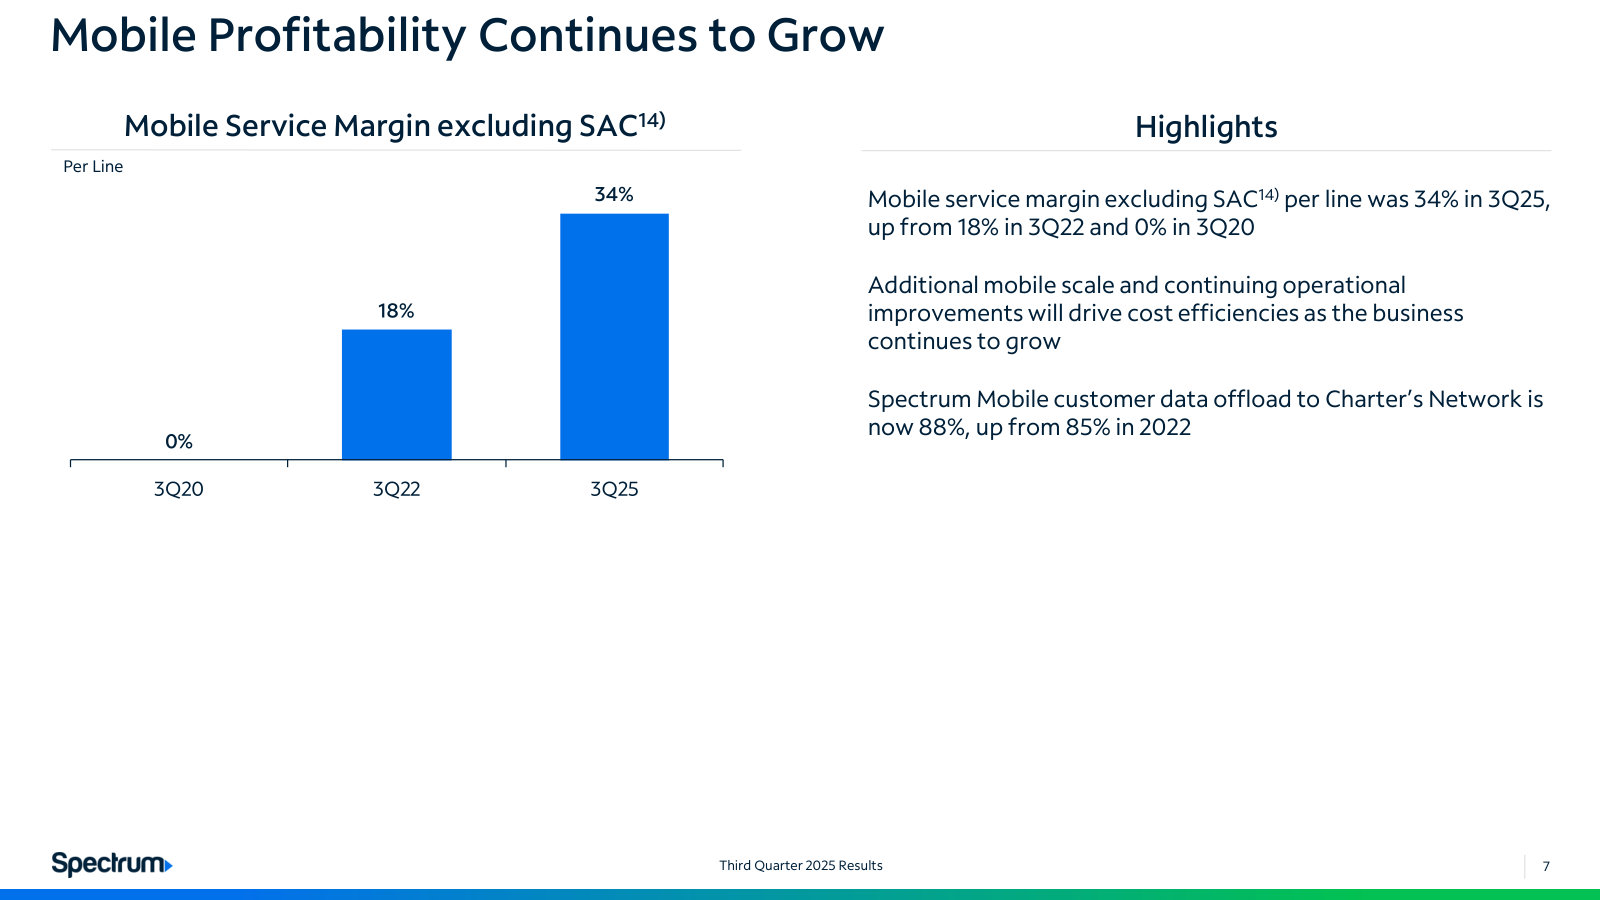
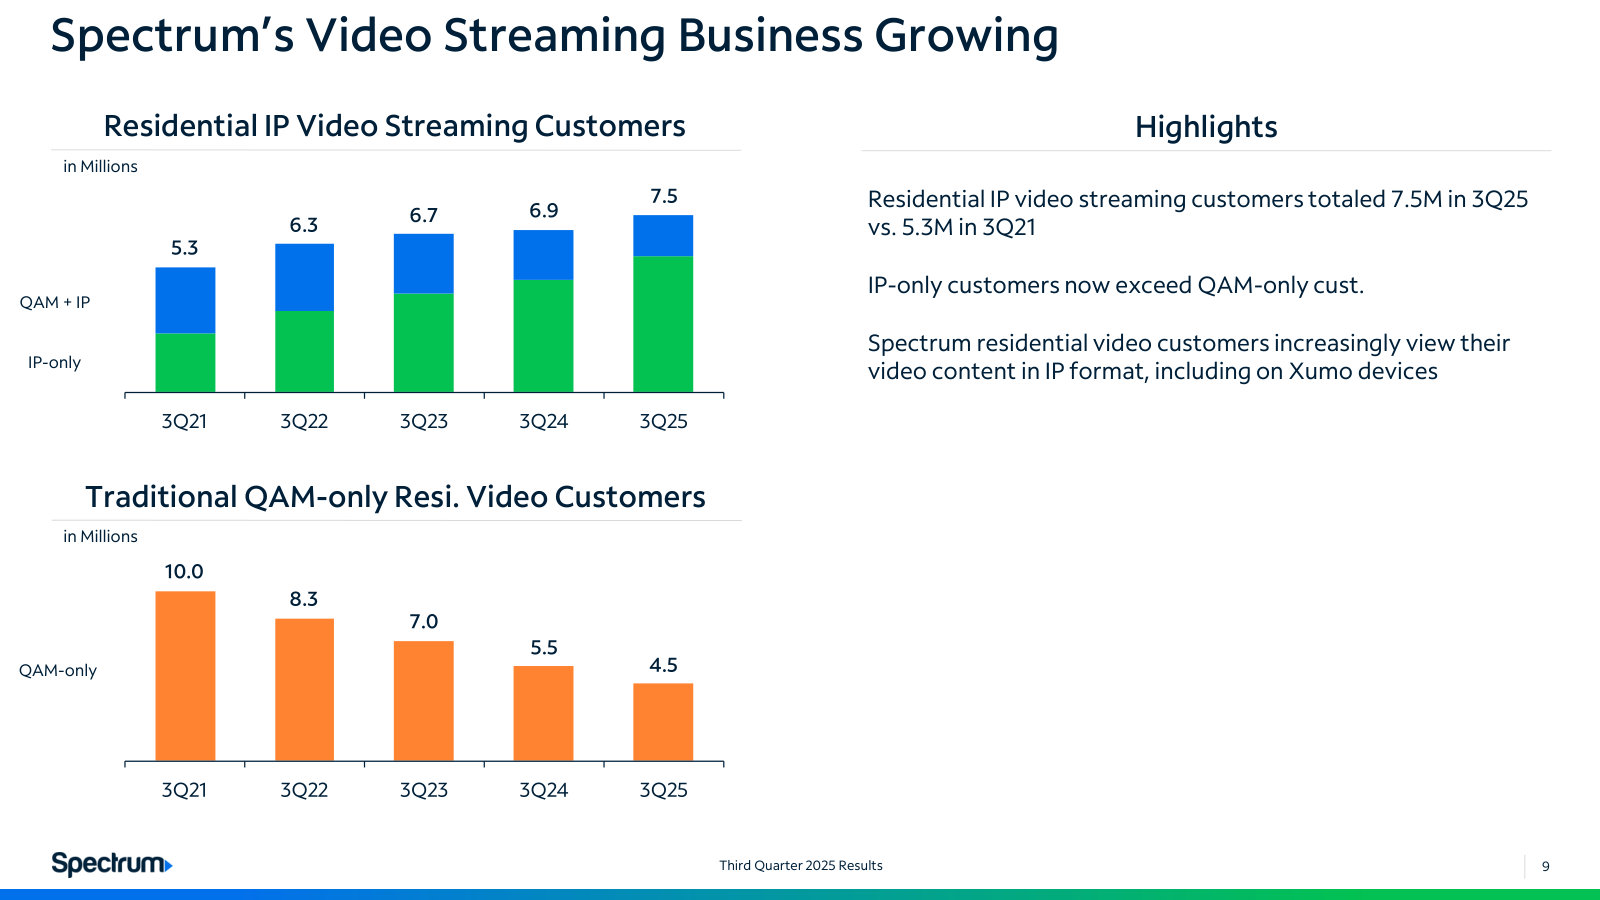
p. 8 — Mobile service margin per line ex-SAC went from 0% in 3Q20 to 34% in 3Q25 — the clearest view of mobile unit economics. · Open the full presentation →p. 10 — Video mix shifting to IP: 7.5M streaming customers against 4.5M traditional QAM-only, over five years. · Open the full presentation →
The Cox combination as management presented it: terms, pro forma scale, structure, ownership and governance of the company Charter becomes. · Open the full document →
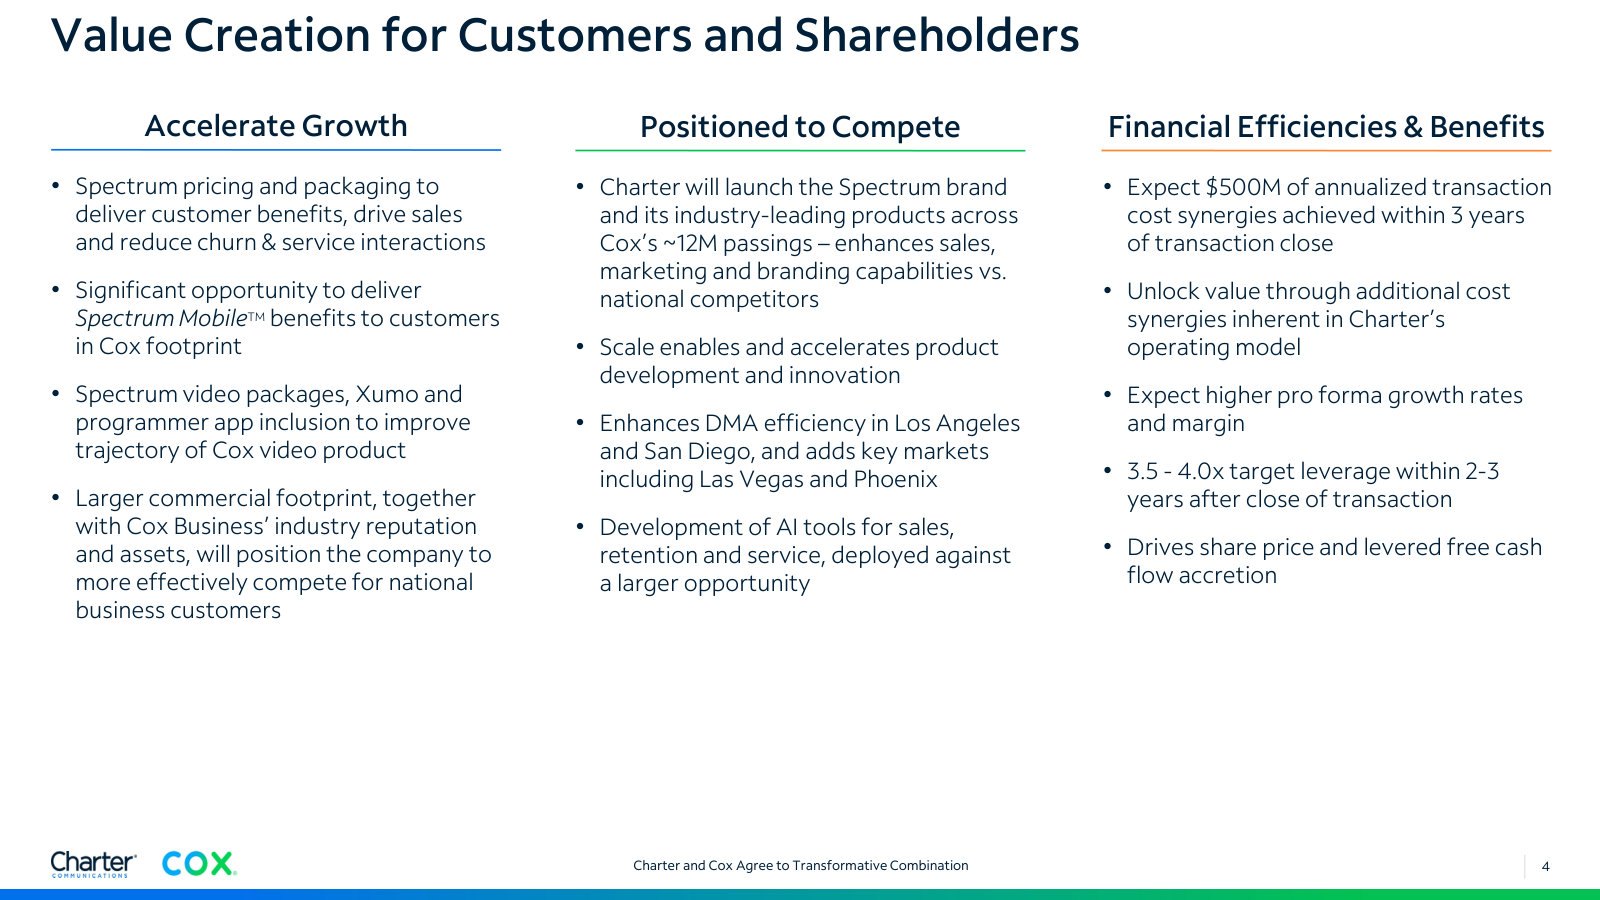
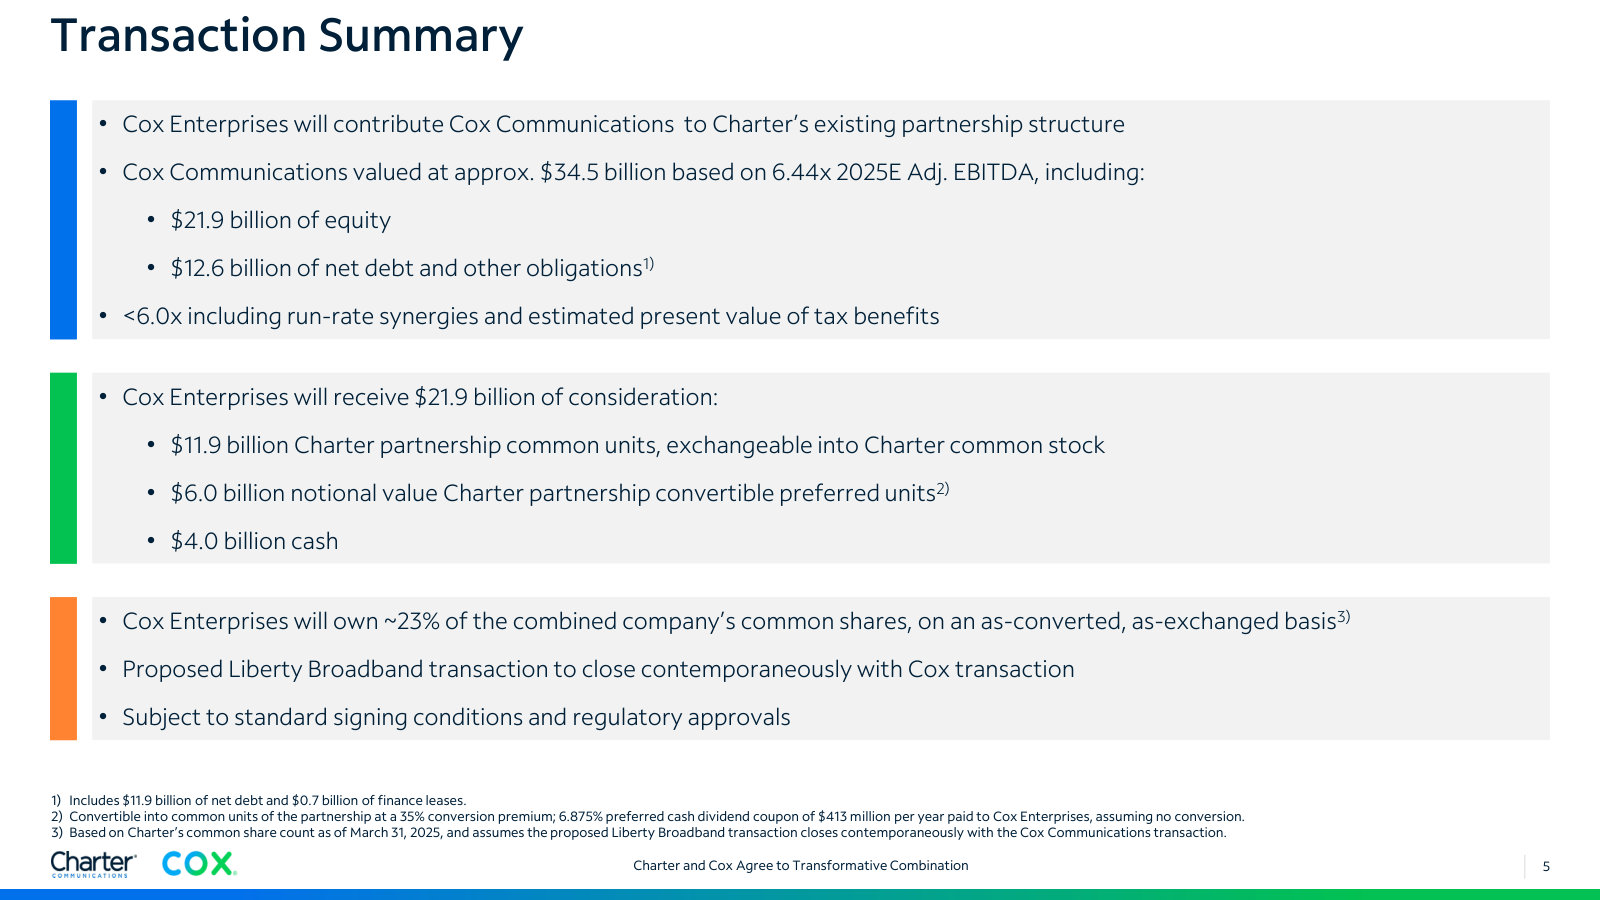
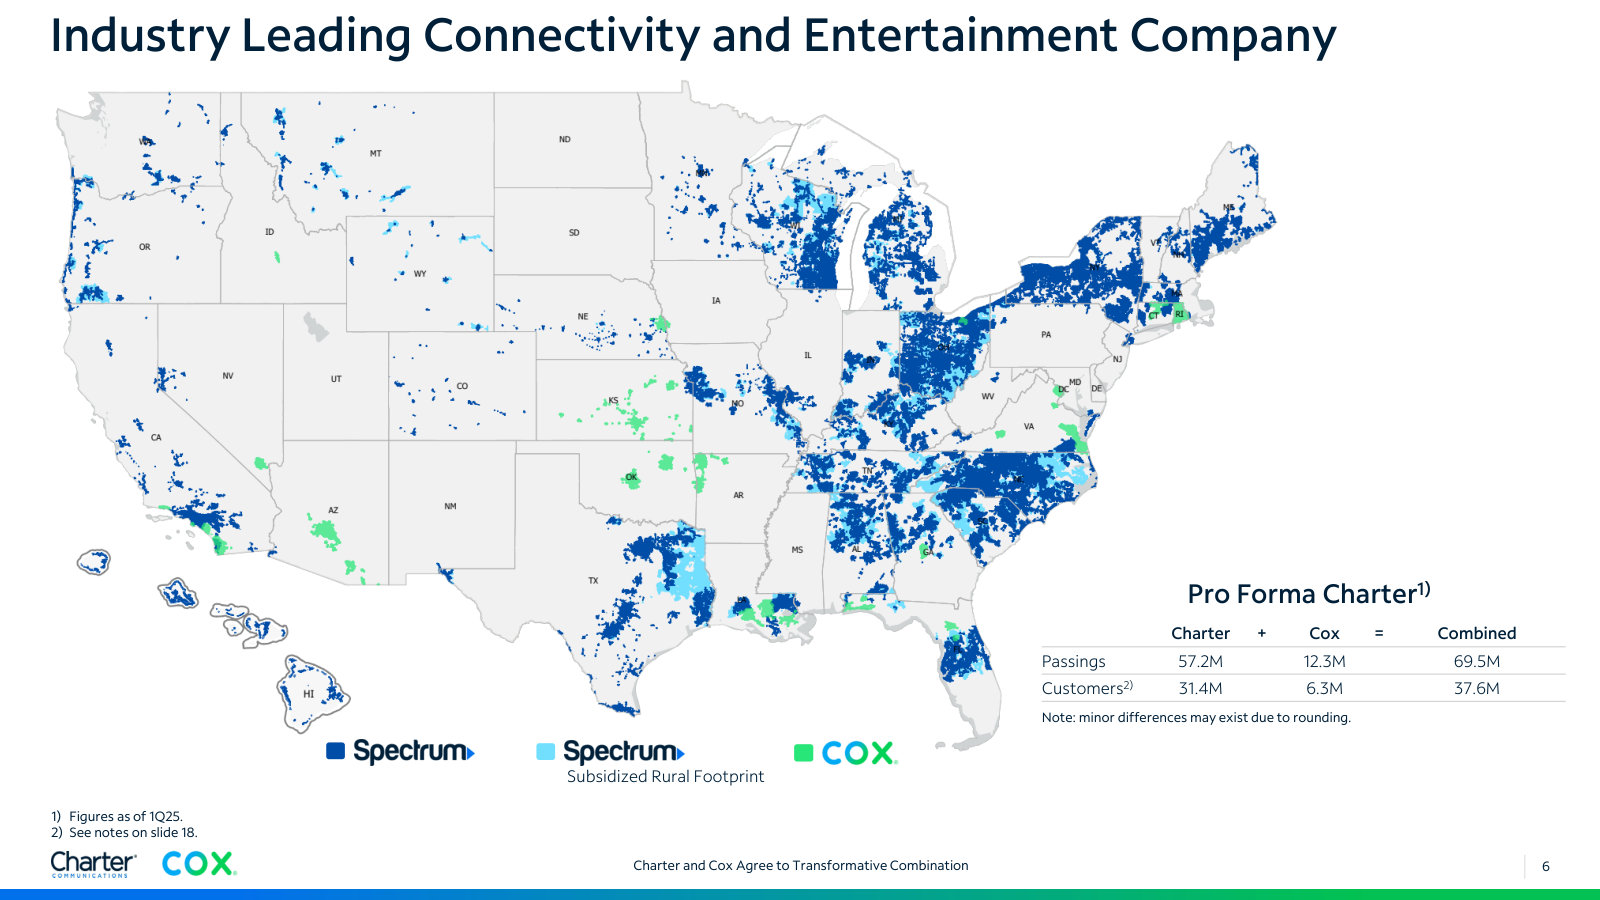
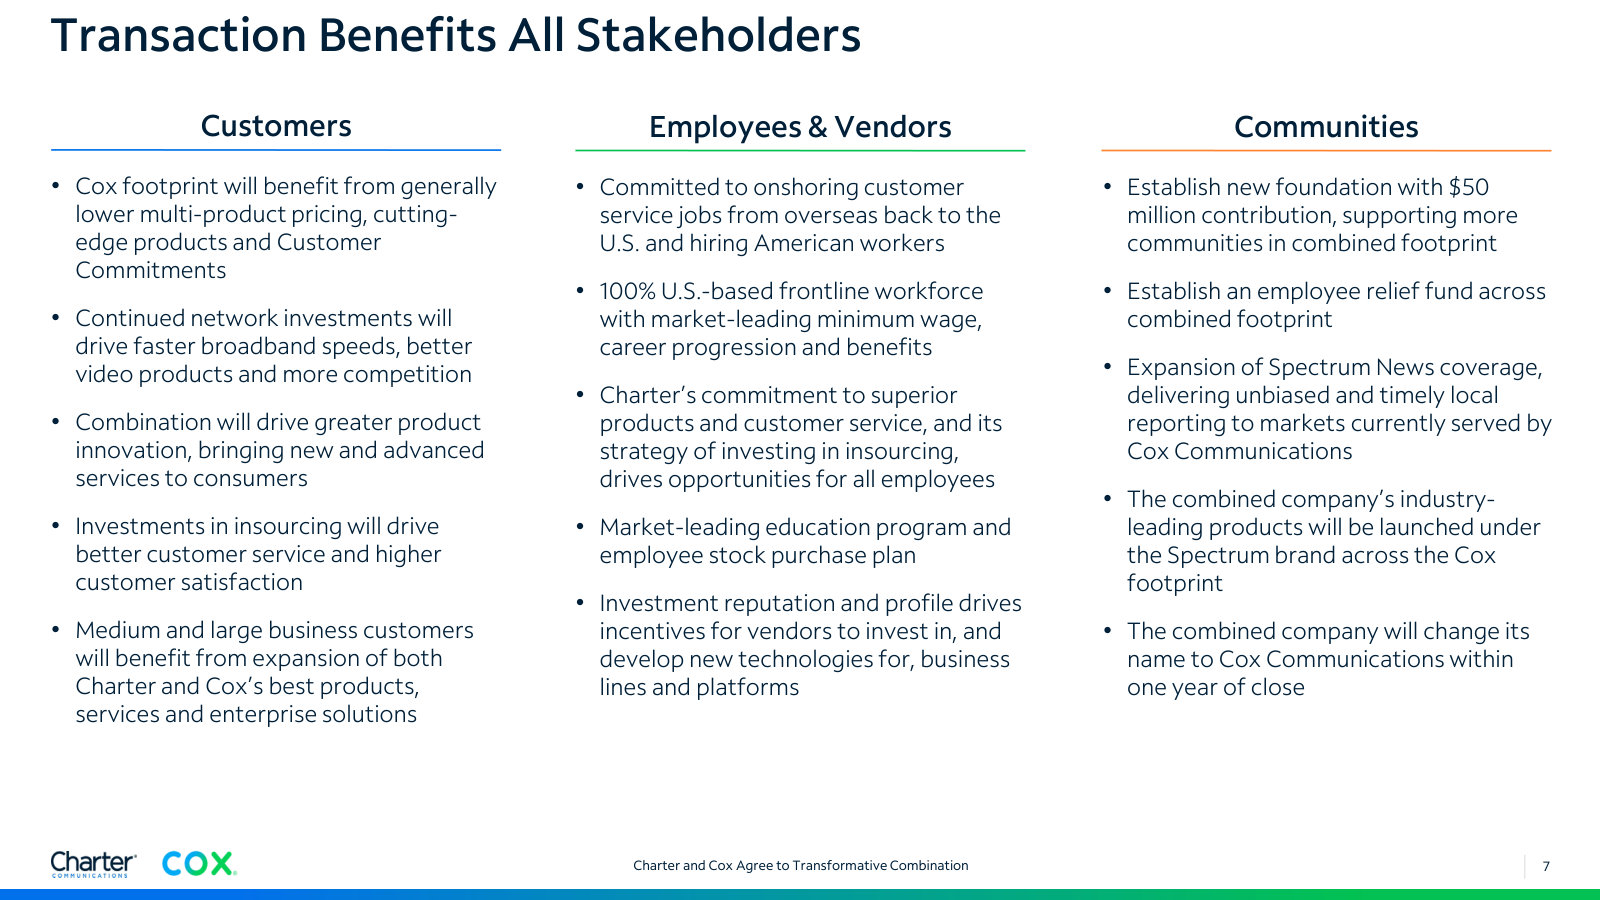
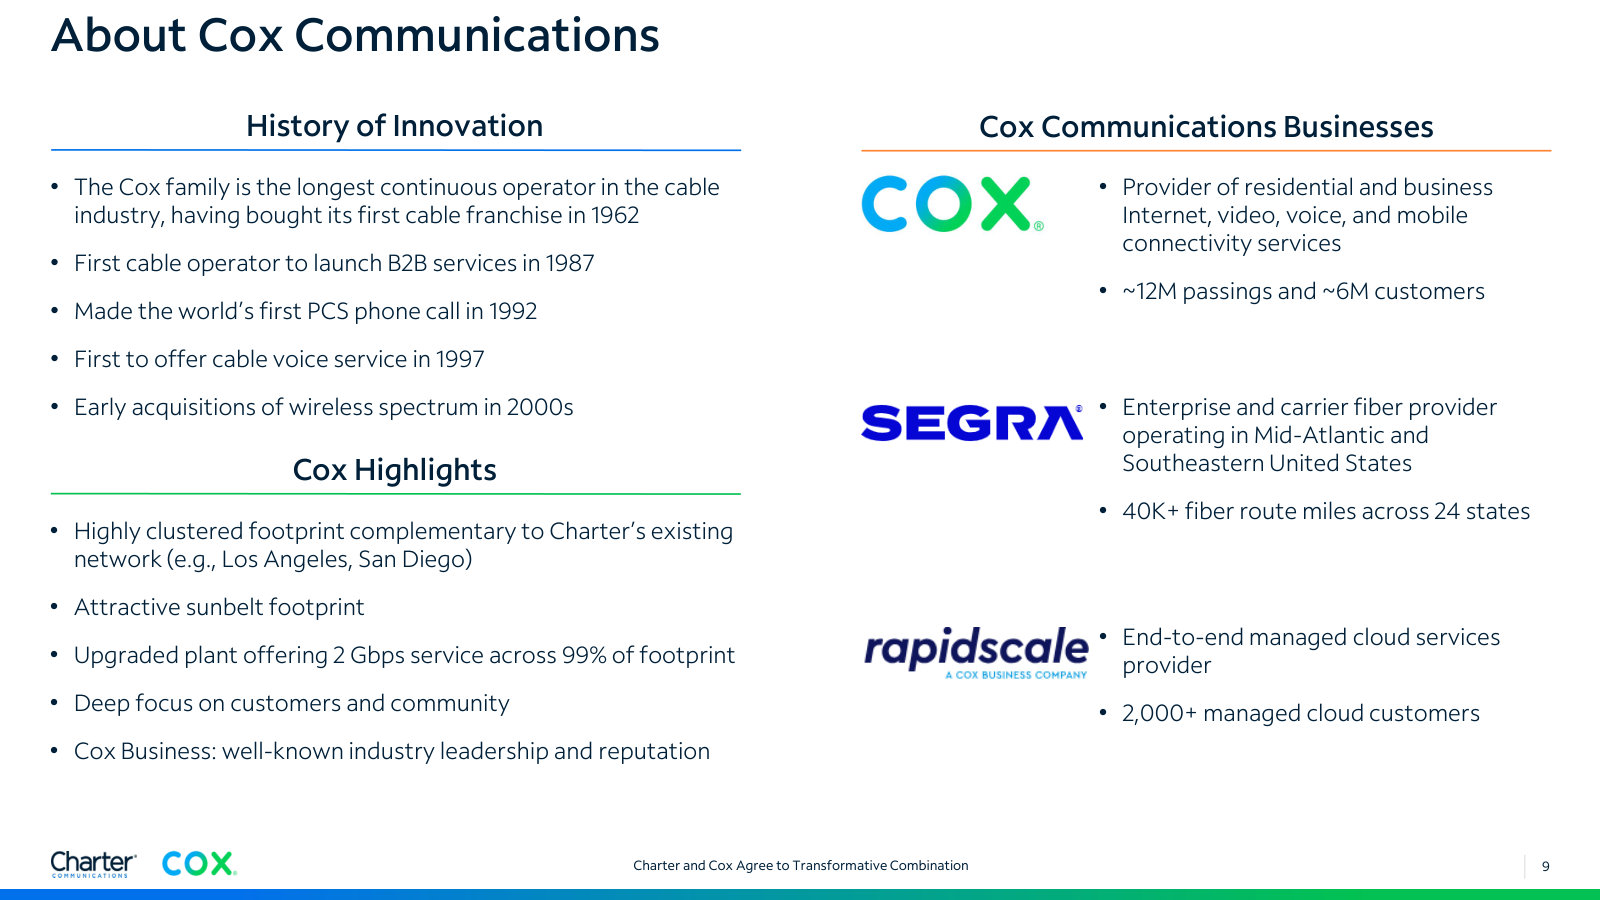
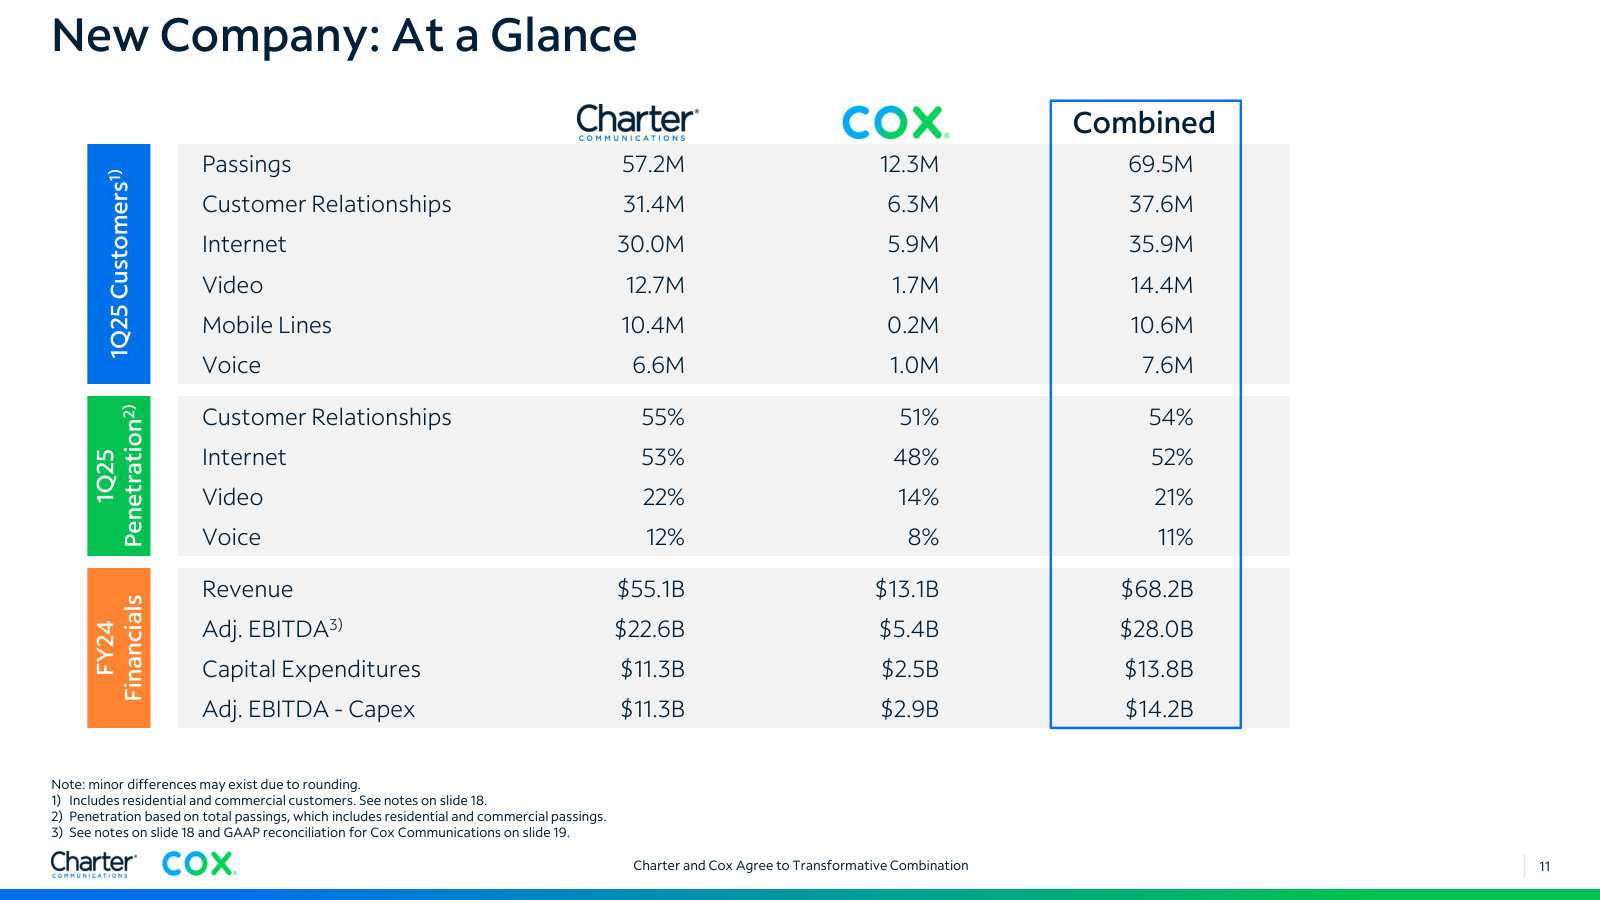
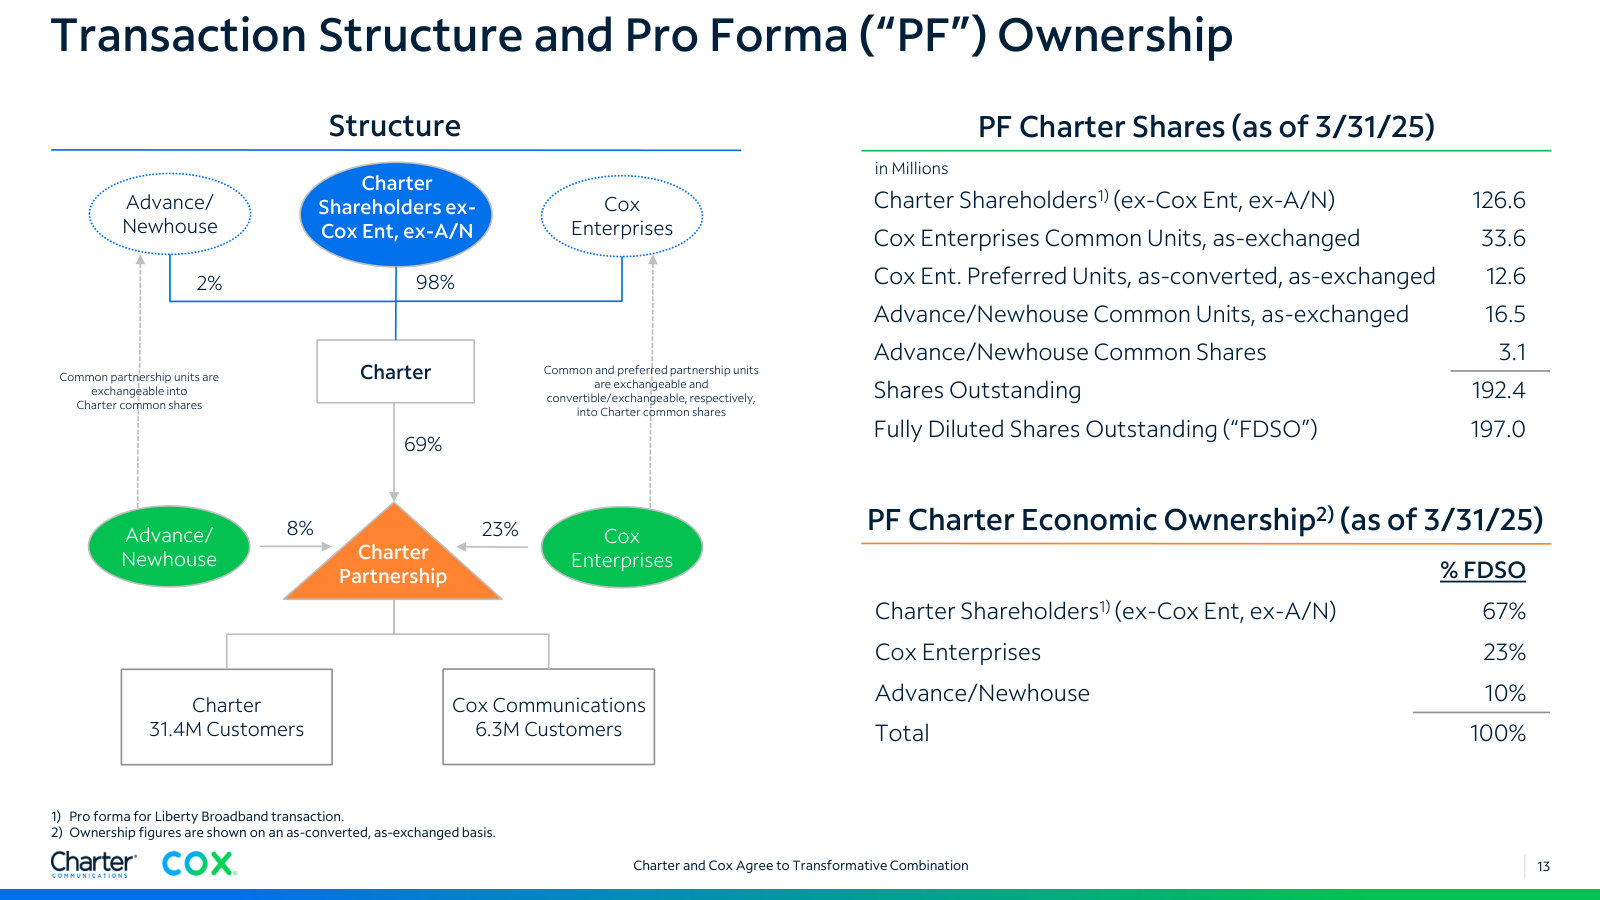
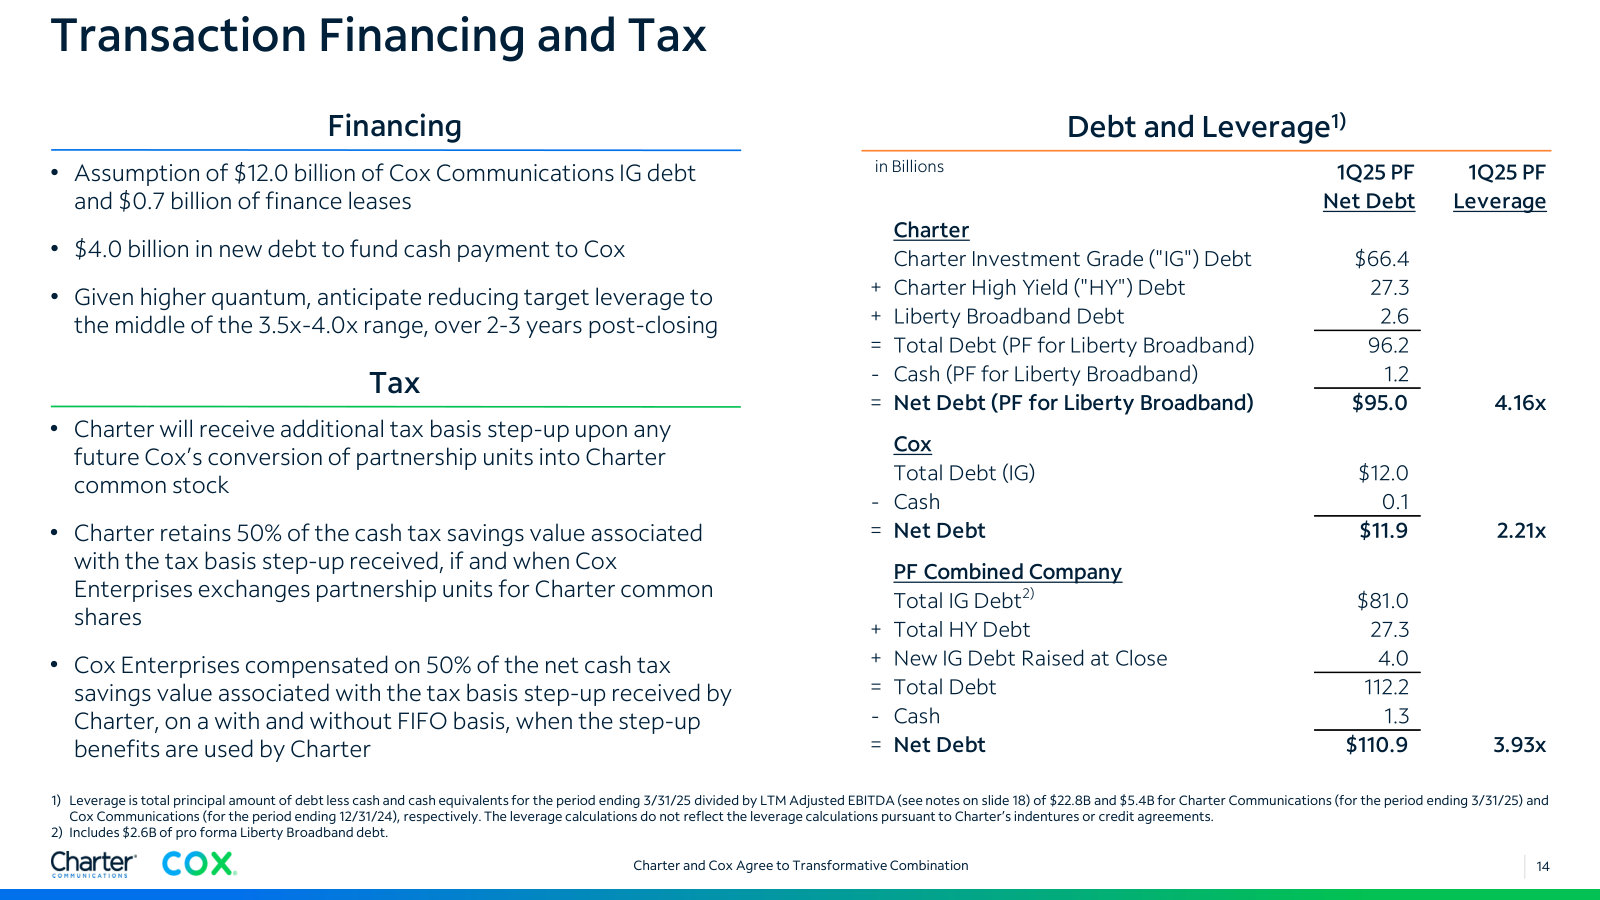
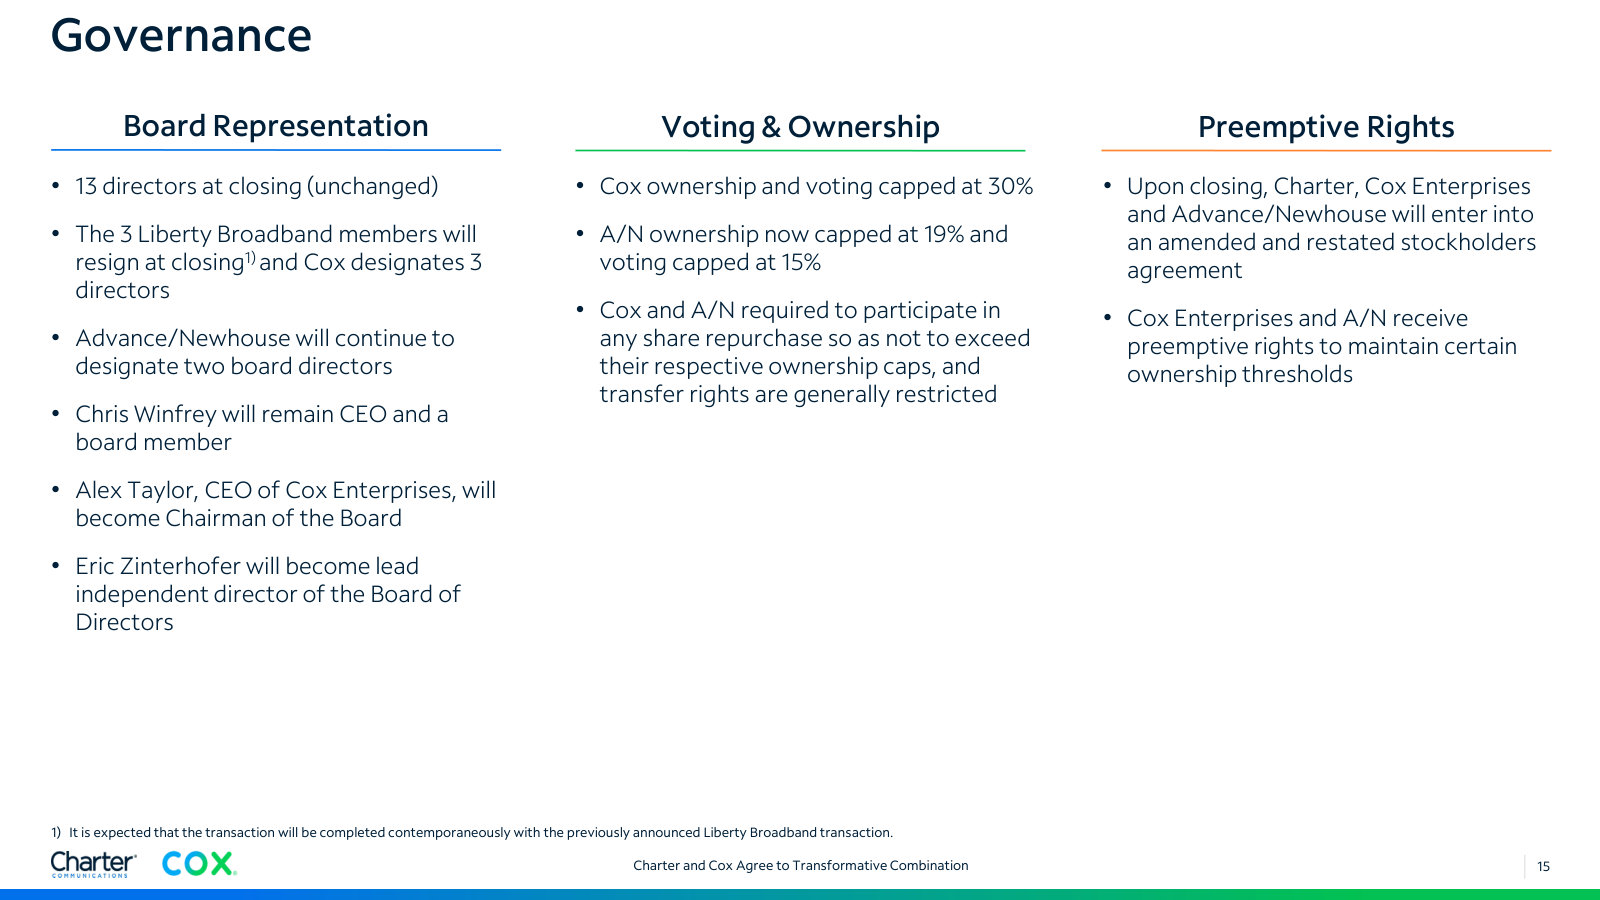
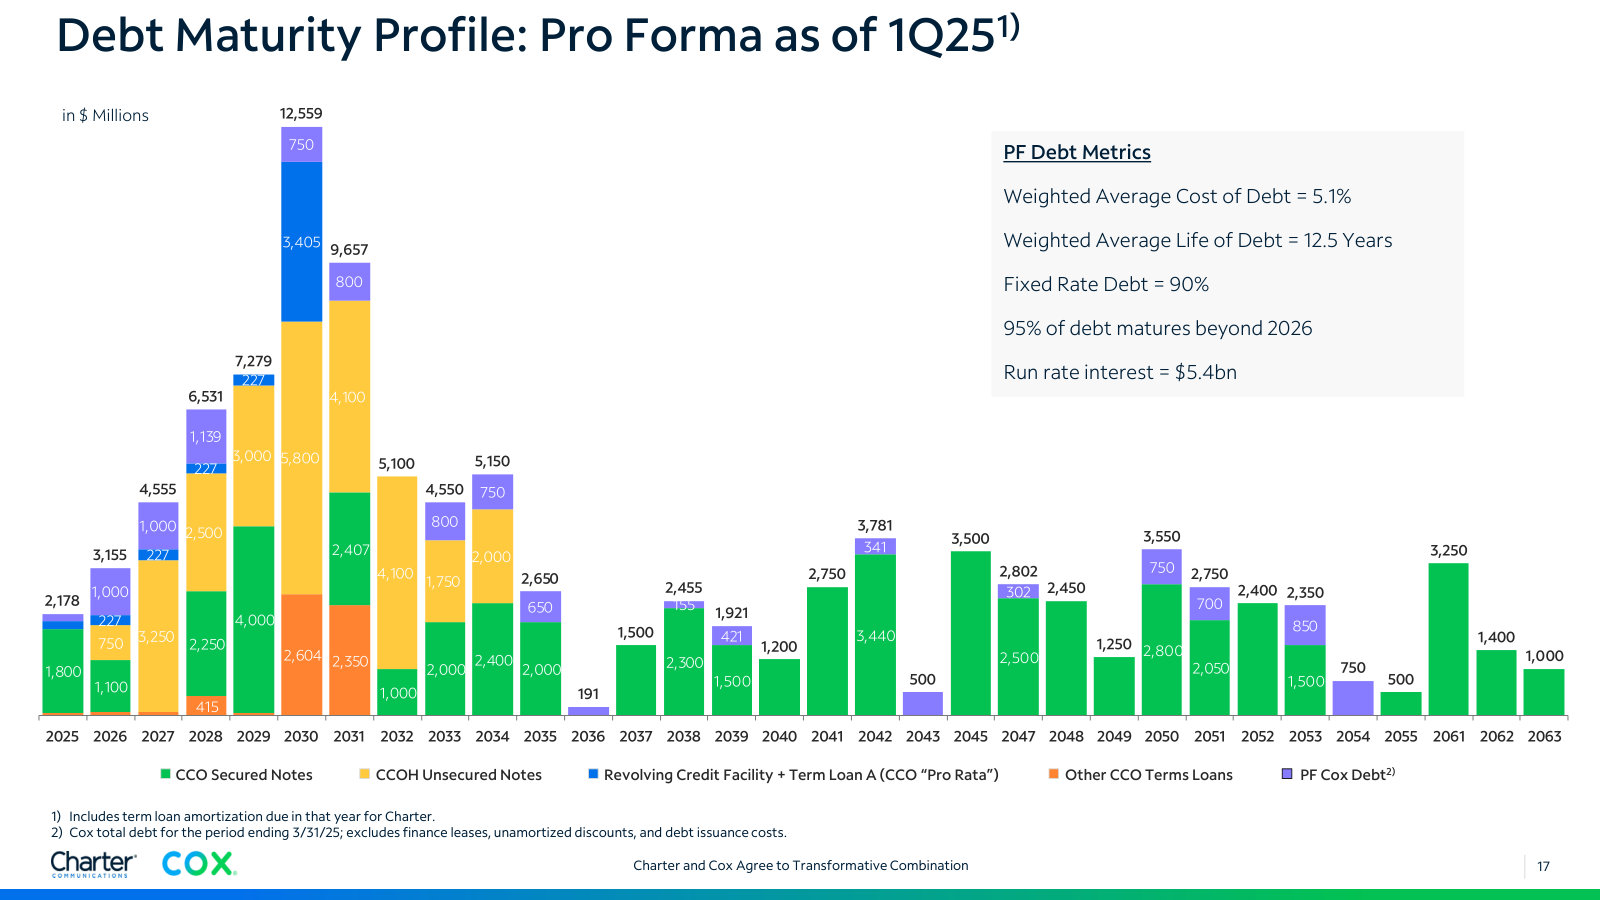
p. 5 — The three-part case for the deal: growth, competitive position and $500M of annualized cost synergies within three years. · Open the full presentation →p. 6 — Terms in brief — Cox valued at ~$34.5B, 6.44x 2025E EBITDA, paid in common units, preferred units and $4.0B cash. · Open the full presentation →p. 7 — Footprint map of the combined company — 69.5M passings and 37.6M customers, with Cox adding Los Angeles, San Diego and Phoenix. · Open the full presentation →p. 8 — Stakeholder commitments, including the pledge to rename the combined company Cox Communications within a year of close. · Open the full presentation →p. 10 — Who Cox is: ~12M passings, ~6M customers, plus the Segra fiber and RapidScale managed-cloud businesses. · Open the full presentation →p. 12 — Charter and Cox side by side on passings, penetration, revenue, EBITDA and capex — the arithmetic of the combination. · Open the full presentation →p. 14 — The partnership structure and pro forma ownership: Charter holders 67%, Cox Enterprises 23%, Advance/Newhouse 10%. · Open the full presentation →p. 15 — How the deal is financed and taxed, and where leverage lands: $110.9B pro forma net debt at 3.93x. · Open the full presentation →p. 16 — Governance after close — Cox capped at 30% and voting, three Cox directors, Alex Taylor as chairman, Winfrey staying CEO. · Open the full presentation →p. 18 — Pro forma maturity ladder: 5.1% weighted average cost of debt, 12.5-year average life, 95% maturing beyond 2026. · Open the full presentation →
2Q 2026 Trending Schedule — 2Q 2026 · 6 pages · Nine quarters of customer, ARPU, revenue, capex and rural-build detail in one set of tables — the source behind the deck charts. · Open →
Debt and Capital Structure Supplement — As of June 30, 2026 · 7 pages · Instrument-level debt schedule, maturity stack and the secured/consolidated leverage path since the Time Warner Cable deal closed. · Open →
Fourth Quarter and Full Year 2024 Results — FY 2024 · 20 pages · The pre-Cox baseline year and the capex outlook, ex-BEAD, that the current multi-year plan was revised from. · Open →
Third Quarter 2024 Results — 3Q 2024 · 16 pages · Where the new pricing and packaging structure and the programmer app inclusion economics were first laid out. · Open →
Fourth Quarter and Full Year 2023 Results — FY 2023 · 25 pages · The subsidized rural construction programme in detail, and the original multi-year capex ramp that peaked in 2025. · Open →